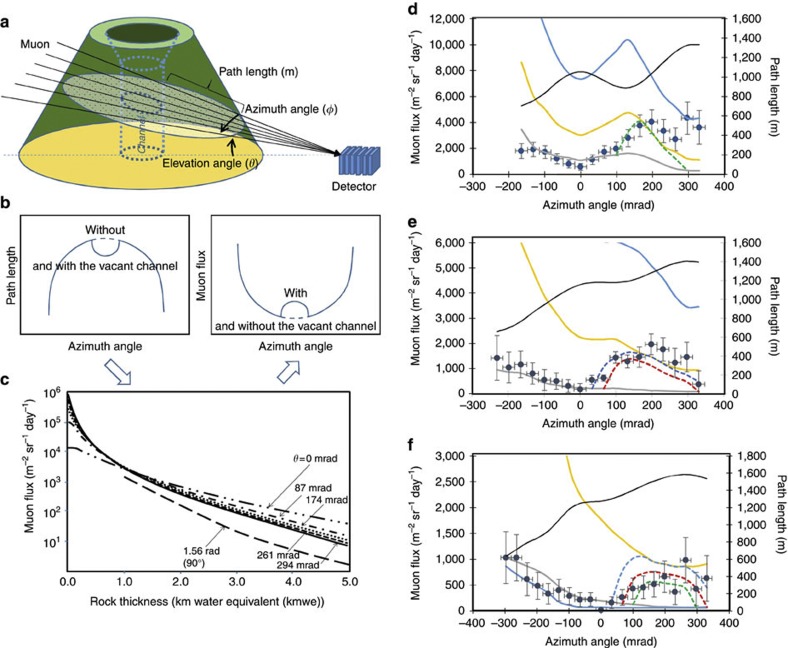
Figure 2. Principle of muographic measurements.
(a) Geometrical arrangement of the detector facing a volcano defines azimuth and elevation angles, as well as path lengths. The path length distribution as a function of azimuth angle is converted to the penetrating muon flux distribution (b) via the flux–thickness relationship (c). (c) The plot shows the flux of muons that have enough energy to continue traversing through a given thickness of rock in units of kmwe (penetrating muon flux), and compares the penetrating muon flux arriving at various elevation angles in units of radian. The data are from Fig. 1 of ref. 6, apart from the 1.56-ad curve. The measured muon flux in Satsuma–Iwojima from the direction of elevation angles of (d) 297±16.5, (e) 264±16.5 and (f) 231±16.5 mrad is included. The measured flux is compared with theoretical flux calculated for various given densities (0.7–2.5 g cm−3). Path length distribution is also plotted for reference. Error bars represent 1 s.d. of statistical uncertainty (1 s.e.). The s.e. was calculated for muon counts in each bin.

