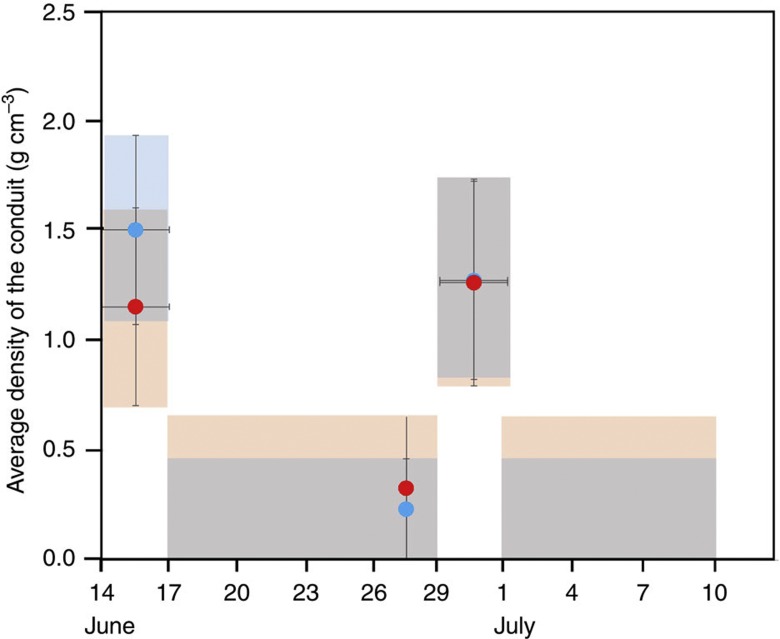
Figure 4. Time-dependent average density of the conduit.
The values as measured during the periods of 14–16 June, 29 June–1 July, are compared with the entire period excluding these two periods for different elevation angles: 297±16.5 mrad (blue dots) and 264±16.5 mrad (red dots). Error bars represent 1 s.d. of statistical uncertainty (1 s.e.). The s.e. was calculated for total muon counts recorded during each period. The blue and orange-shaded areas indicate 1σ (68% CL) zone for each elevation angle.

