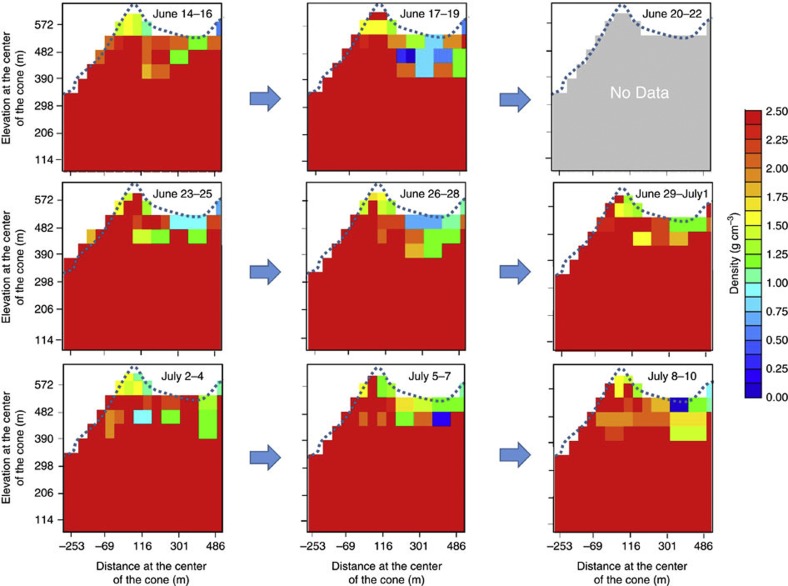
Figure 5. Time sequential muographic animation.
The plots show the angular distribution of 1σ (68% CL) upper limit of the average density along the muon path. The frame rate is 10 FPM. The data were not taken during 20–22 June due to a blackout. Horizontally adjacent two bins were packed in order to achieve higher and more accurate statistics. The elevation and horizontal distances at the centre of the cone are shown.

