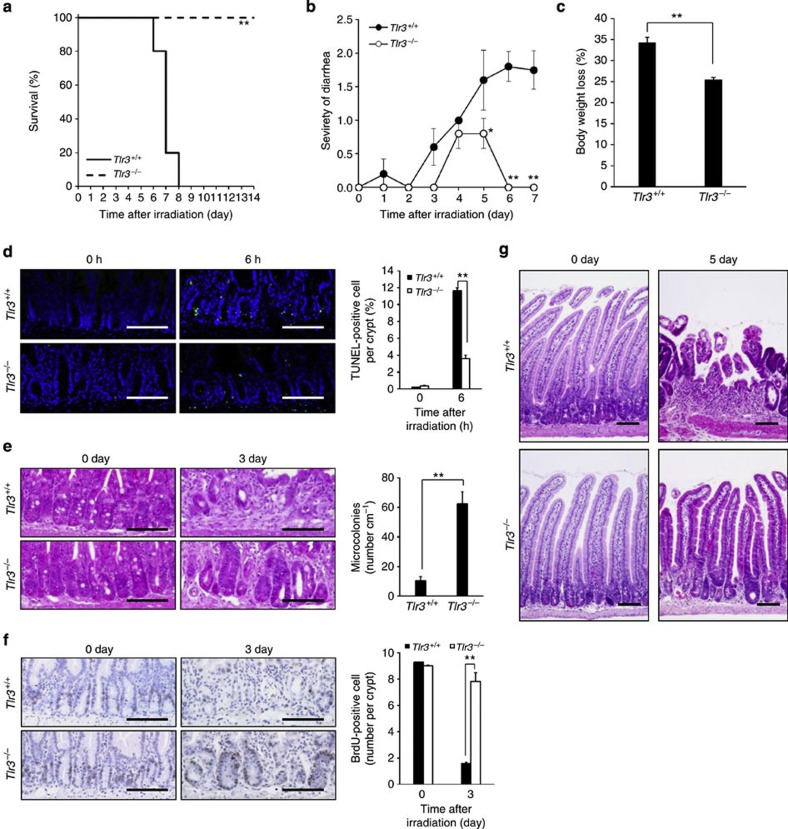
Figure 2. Tlr3−/− mice avoid GIS because of reduction in radiation-induced crypt cell death.
(a) Kaplan–Meier survival analysis of Tlr3+/+ and Tlr3−/− mice treated with TBI and isologous BMT. n=5; **P<0.01 (log-rank test). (b) Severity of diarrhea of Tlr3+/+ and Tlr3−/− mice. n=5; results are means±s.e.m. *P<0.05; **P<0.01 (unpaired two-tailed Student’s t-test). (c) Body weight loss of Tlr3+/+ and Tlr3−/− mice at day 5. n=5; results are means±s.e.m. **P<0.01 (unpaired two-tailed Student’s t-test). (d) TUNEL-staining of the small intestines of Tlr3+/+ and Tlr3−/− mice at 0 and 6 h. TUNEL-stained epithelium shows green fluorescence. Nuclei were stained with DAPI (blue). Scale bar, 100 μm. The right-hand panel shows numbers of TUNEL-positive cells. n=4; results are means±s.e.m. **P<0.01 (unpaired two-tailed Student’s t-test). (e) H&E staining of the small intestinal crypts of Tlr3+/+ and Tlr3−/− mice at days 0 and 3. Scale bar, 100 μm. Asterisks denote microcolonies. Right panel shows the numbers of microcolonies. n=3; results are means±s.e.m. **P<0.01 (unpaired two-tailed Student’s t-test). (f) Immunohistochemical detection of BrdU in small intestinal crypts of Tlr3+/+ and Tlr3−/− mice at days 0 and 3. Scale bar, 100 μm. The right-hand panel shows the numbers of BrdU-incorporating cells. n=3; results are means±s.e.m. **P<0.01 (unpaired two-tailed Student’s t-test). (g) H&E staining of Tlr3+/+and Tlr3−/− small intestines at days 0 and 5. Scale bar, 100 μm. Results are representative of three independent experiments.

