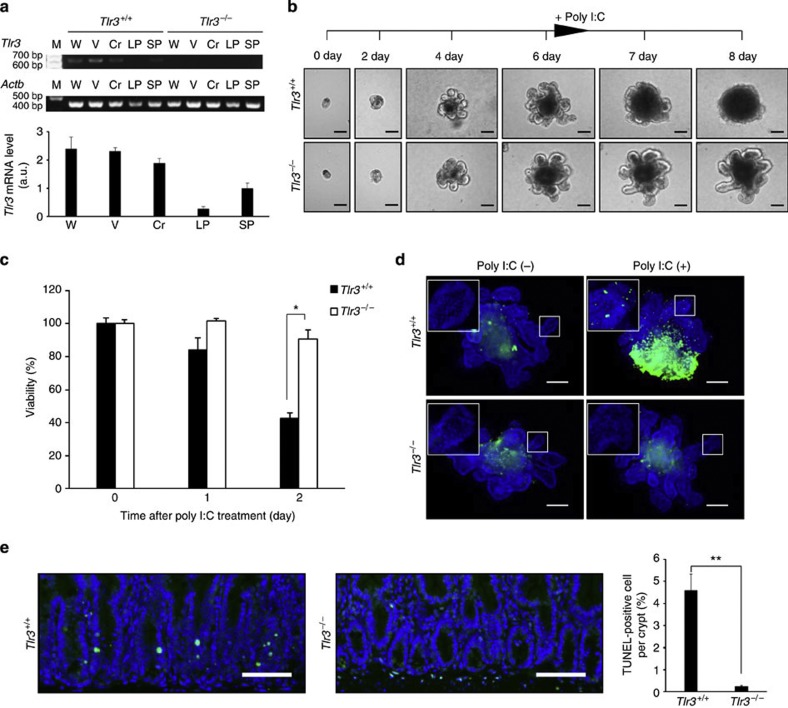
Figure 3. Ligand stimulation of TLR3 directly induces cell death in small intestinal crypts.
(a) RT-PCR (top) and quantitative real-time PCR (bottom) of Tlr3 mRNA in the small intestines of Tlr3+/+ and Tlr3−/− mice. Cr, crypt; LP, lamina propria; M, size marker; SP, spleen; V, villi; W, whole intestine. n=3; results are means±s.e.m. (b) Representative images of Tlr3+/+ and Tlr3−/− organoids. Crypts were incubated with poly I:C after day 6 of culture. Scale bar, 100 μm. (c) Viability of Tlr3+/+ and Tlr3−/− organoids after poly I:C treatment. n=4; results are means±s.e.m. *P<0.05 (unpaired two-tailed Student’s t-test). (d) TUNEL-staining of Tlr3+/+ and Tlr3−/− organoids at 1 day after poly I:C treatment. TUNEL-stained epithelium shows green fluorescence. Nuclei were stained with DAPI (blue). Insets show higher magnification of the crypt-like domain. Scale bar, 100 μm. (e) TUNEL-staining of the small intestinal crypts of Tlr3+/+ and Tlr3−/− mice 6 h after poly I:C injection. TUNEL-stained epithelium shows green fluorescence. Nuclei were stained with DAPI (blue). Scale bar, 100 μm. The right-hand panel shows numbers of TUNEL-positive cells. n=3; results are means±s.e.m. **P<0.01 (unpaired two-tailed Student’s t-test). Results are representative of three independent experiments.

