Figure 1.
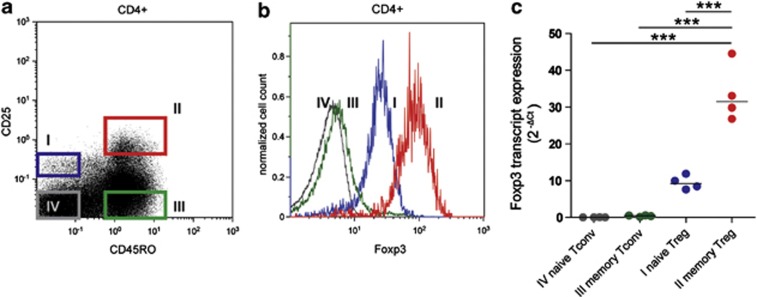
Purification of naive and memory Tconv and Treg populations. (a) Representative fluorescence-activated cell sorting (FACS) dot plot depicting the gating strategy for purification of CD4+, naive and memory Treg and Tconv subsets, based on the expression levels of CD45RO and CD25: I naive Tregs (CD45RO−CD25++), II memory Tregs (CD45RO+CD25+++), III memory Tconvs (CD45RO+CD25−) and IV naive Tconvs (CD45RO−CD25−). (b) Representative histogram depicting FACS analysis of Foxp3 protein expression in four CD4+ T-cell subsets. (c) Naive Tregs, memory Tregs, memory Tconvs and naive Tconvs were FACS purified from peripheral blood mononuclear cell (PBMC) of healthy donors, and Fosxp3 transcript levels were analyzed by qRT-PCR. Relative expression, normalized to the average of TATA box binding protein and RPII reference genes is shown. Lines indicate median expression values. Each dot represents a separate donor (n=4). Statistical analysis: repeated measures analysis of variance test with Bonferroni's multiple comparison post-test. ***P<0.0001.

