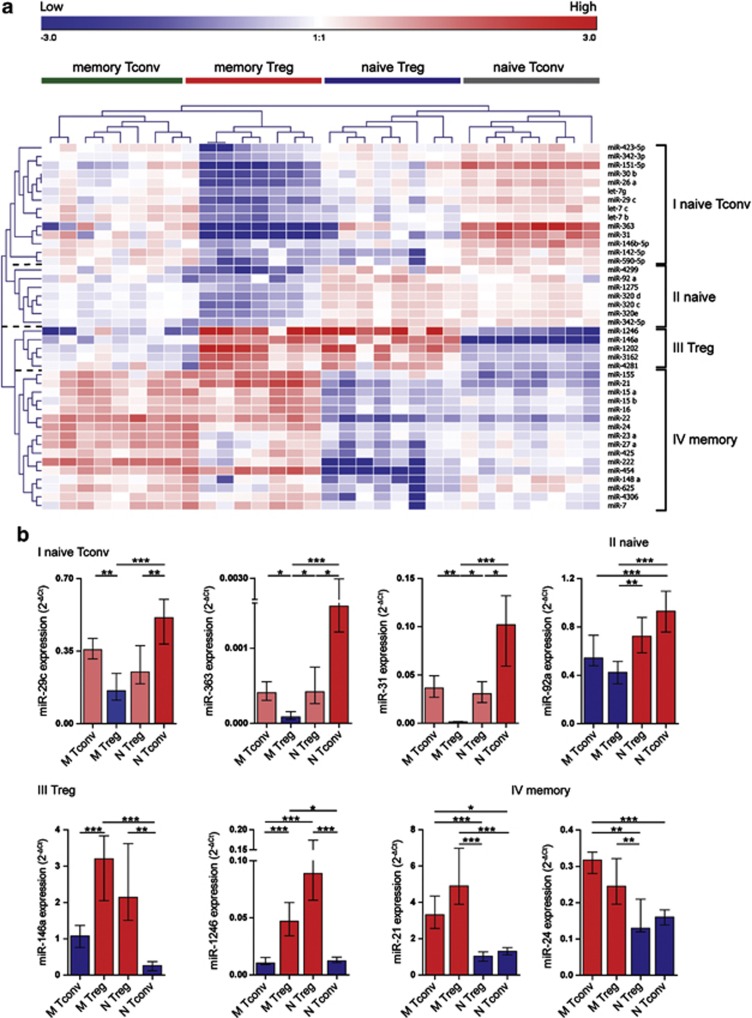
Figure 4.
MiRNA signatures characterizing T-cell subsets. (a) Heatmap (Pearson's correlation, median centering miRNAs, complete linkage) showing the miRNA expression signatures that characterize Tconvs and Tregs in 32 samples derived from six RA patients and two healthy controls, using miRNA microarray. Statistical analysis of 121 detected miRNAs revealed 42 miRNAs significantly differently expressed between T-cell subsets of eight donors (n=32 samples, Friedman's test, P<0.005, fold difference ⩾2 in at least one of six comparisons). Top legend (red to blue) depicts range of expression values (log values). Each T-cell subset is characterized by specific miRNA signature. (b) Eight miRNAs, differentially expressed between the four clusters as identified in a, were selected for qRT–PCR validation in a new cohort of donors (n=14, Table 1, qRT–PCR validation). Relative expression, normalized to the average of RNU44 and RNU48 reference genes is shown. Data are depicted as median values with interquartile range. Statistical analysis: Friedman's test with Dunn's multiple comparison post-test. *P<0.05, **P<0.01, ***P<0.0001.

