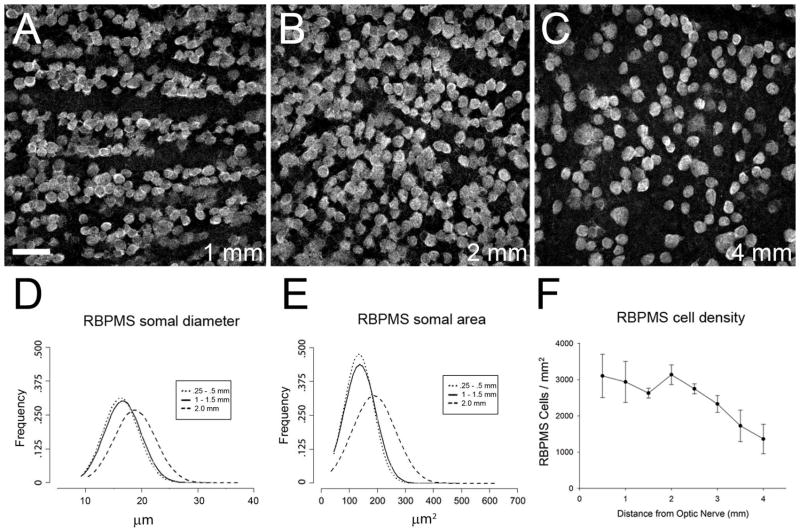
Figure 7.
Distribution of RBPMS cells in rat retina. A–C: Rat GCL in a whole-mount at 1, 2, and 4 mm from the optic nerve head, respectively. D: Frequency of RBPMS somal diameters in central (dotted line, solid line) and peripheral retina (dashed line). E: Frequency of RBPMS areas in central (dotted line, solid line) and peripheral retina (dashed line). F: RBPMS cell density vs. distance from the optic nerve head (N=4 retinas). z-step = 1.1 μm. 11 optical sections were compressed for viewing. RBPMS antibody GP15029. Scale bar = 50 μm.

