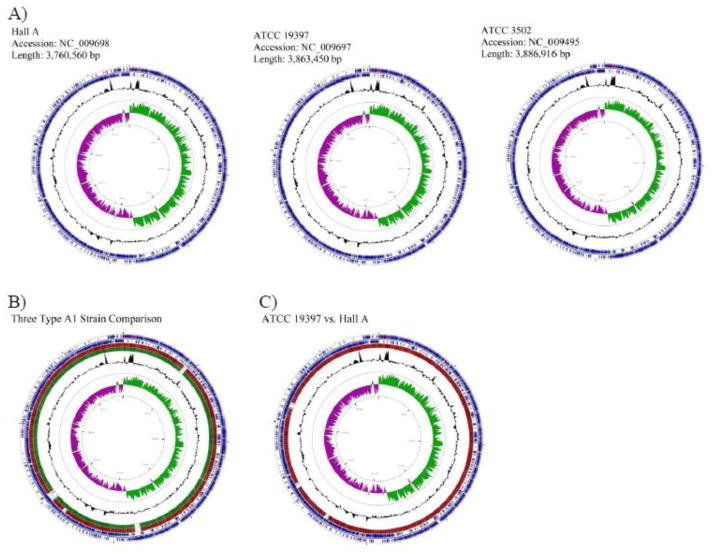
Figure 2.
Circular chromosome maps of Hall A, ATCC 19397, and ATCC 3502 (A). A comparative circular map of the three genomes (B) and ATCC 19397 with Hall A (C) was generated by CGView Server. The two outer blue rings represent genes on the forward and reverse strand of the indicated strains (A), or the reference strain, ATCC 3502 (B), or ATCC 19397 (C). Within the two outer circles contains tRNA (red) and rRNA (purple). Alignments of the reference genome to Hall A and ATCC 19397 are shown in red and dark green, respectively. The number of lines is proportional to the percent identity of the hit compared to the reference genome. The GC% is shown in black below and above mean. GC skew is shown in purple and green representing below and above, respectively. The inner circle displays distance of bases.

