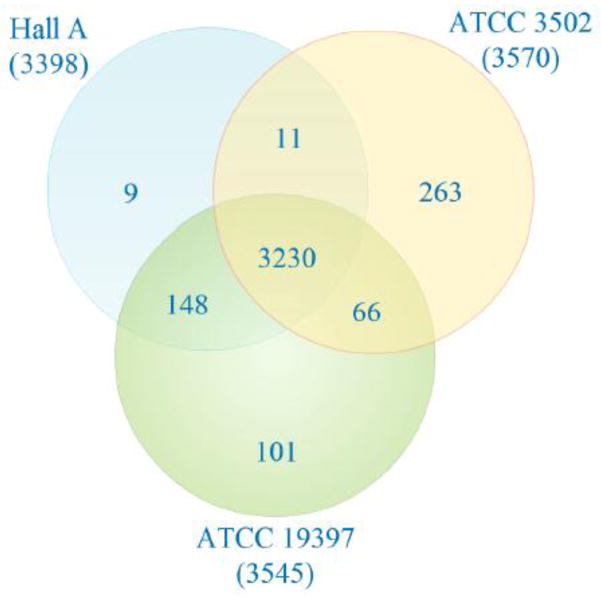
Figure 3.
Venn diagram comparing genes of ATCC 3502, ATCC 19397, and Hall A. The orange circle refers to the genes of ATCC 3502 whereas the green circle refers to the genes of ATCC 19397, and the blue circle refers to genes of Hall A. Numbers in parentheses under each strain name refer to the total number of genes in that particular strain. Numbers in overlapping areas are considered core genes while the number outside the overlapping area displays the number of genes unique to that specific genome. Information was gathered from Efficient Database Framework for comparative Genome Analyses using BLAST score Ratios (EDGAR) using GenBank files from NCBI and plotted in Creately.

