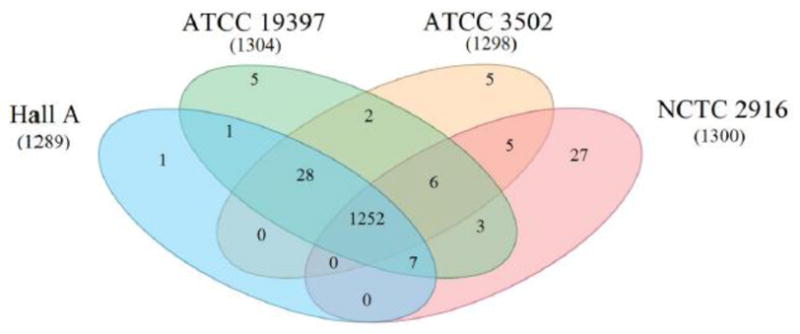
Figure 5.

Venn diagram grouping based on COG functional relationships within C. botulinum subtype A1 strains. Numbers in parentheses under each strain name refer to the total number of COG functional groups in that particular strain. Overlapping areas signify common groups between strains. Core group number is found in the center of the figure where all four circles overlap. Functional group list was exported from IMG database and plotted in Creately.
