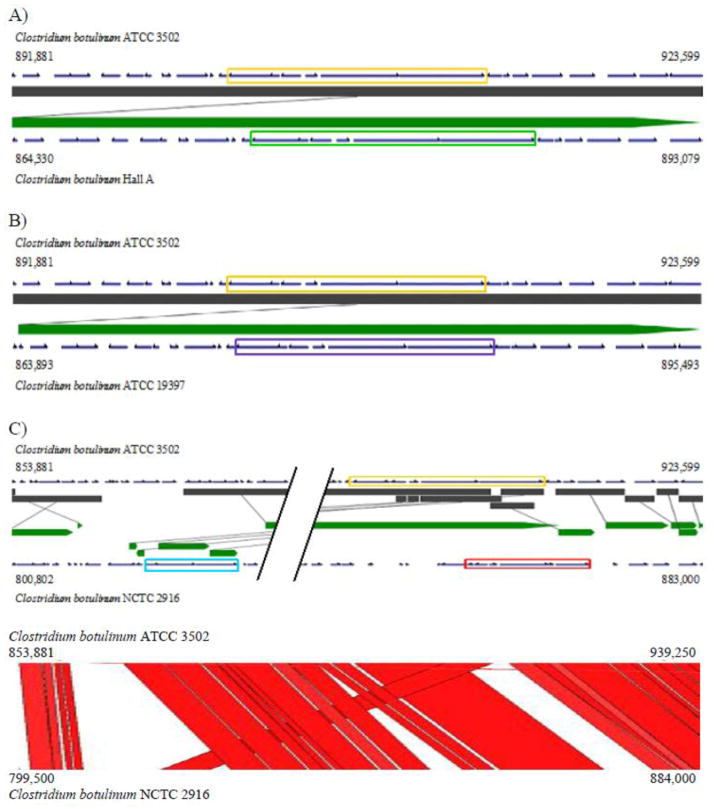
Figure 7.
Analysis of botulinum neurotoxin gene clusters of ATCC 3502, Hall A, ATCC 19397, and NCTC 2916. (A–C) VistaSynteny alignments showing neurotoxin gene cluster (CBO0801–CBO0806) (orange rectangle) using ATCC 3502 as the reference genome against Hall A (A), ATCC 19397 (B), and NCTC 2916 (C). VistaSynteny of ATCC 3502 between Hall A and ATCC 19397 include genes ±10 kb flanking neurotoxin gene cluster. VistaSynteny and ACT of ATCC 3502 and NCTC 2916 include genes +10 kb downstream and −48 kb upstream from the neurotoxin gene cluster on ATCC 3502. The bont A1 gene cluster, HA+ (B) cluster, and orfX+ A1 cluster are indicated by rectangular boxes colored orange, red, and blue, respectively. Parallel lines within the VistaSynteny of ATCC 3502 and NCTC 2916 represent ~24 kb of homology between the two genomes. The dark grey and green bars in the VistaSynteny graphs represent the homologous fragments of the reference genome (top) and the query genome (bottom), respectively. The homologous fragments are connected using grey lines. Genome structures were obtained from GenBank via IMG.

