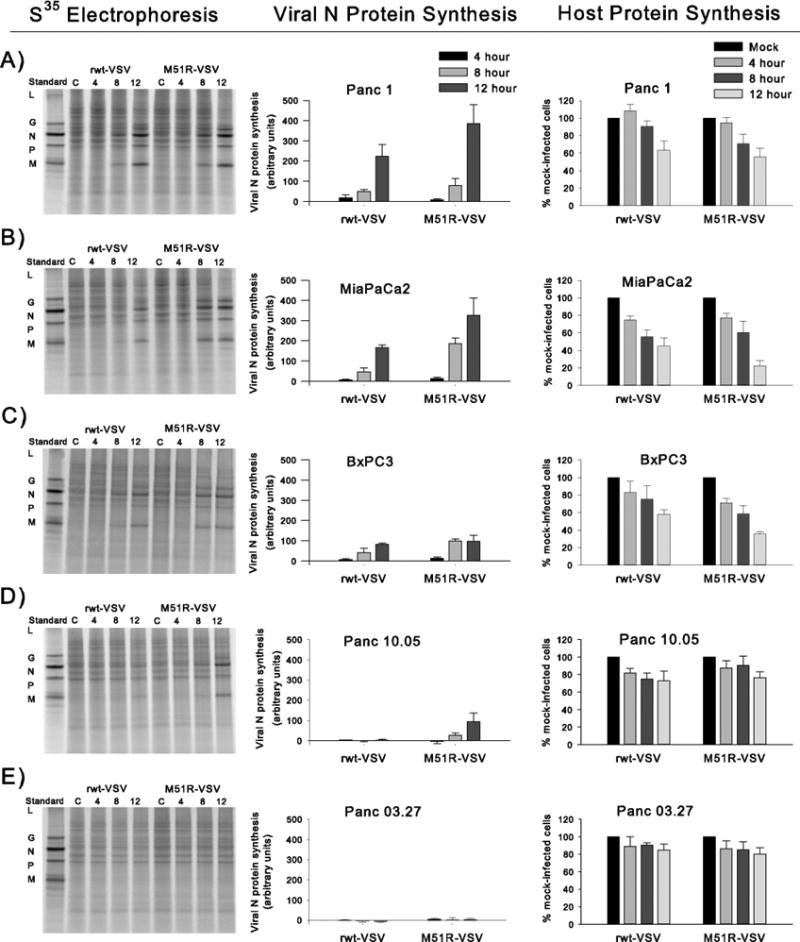
Figure 3.

Viral and host cell protein synthesis in response to rwt-VSV and M51R-VSV infections. After viral infection at an MOI of 5 pfu/cell, cells were labeled with [35S]methionine at specified times. Proteins were analyzed by SDS-PAGE and phosphorescence imaging. In the first column representative phosphorescence images are displayed for each cell line. Standard viral proteins (L, G, N, P, and M) are shown in the first lane in each image as reference. The graphs in the middle column represent viral protein synthesis. In order to compare cell types, the radioactivity of the N protein in each lane was quantified and normalized by dividing the intensity of the N protein band by the intensity of a comparable region in mock-infected cells. In the final column, host cell protein production is quantified by measuring the signal intensity of two sections in each lane between viral protein bands and is presented as a percentage intensity from mock-infected cells. Results for each cell line are presented by row: (A) Panc 1, (B) MiaPaCa2, (C) BxPC3, (D) Panc10.05, and (E) Panc 03.27. Data in the graphs are expressed as the mean of each experimental result ± standard deviation of at least three independent experiments.
