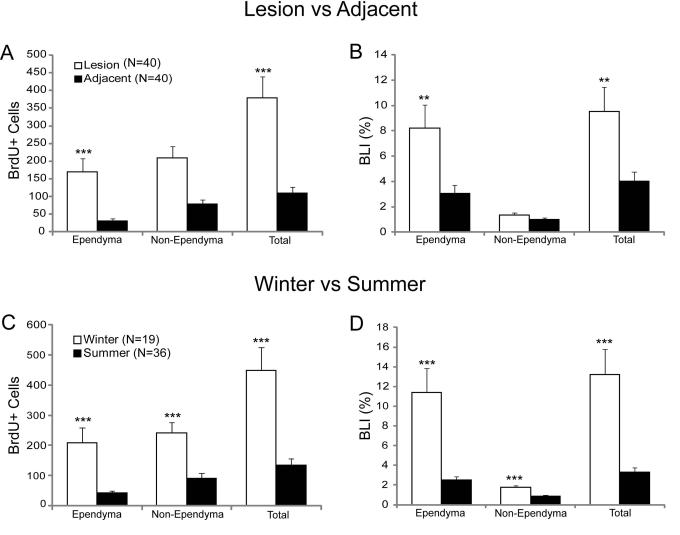
Fig. 3. Effect of spinal cord transection on BrdU labeling.
A and B: BrdU labeling in the lesion site and adjacent cord in all animals (winter + summer). C and D show BrdU labeling in winter and summer of total SC transected animals (1 week to 3 weeks). Graphs show mean ±SEM, ** p≤0.01, *** p≤0.001. N’s in A refer to the number of animals used in A and B. N’s in C are the number of animals in C and D.

