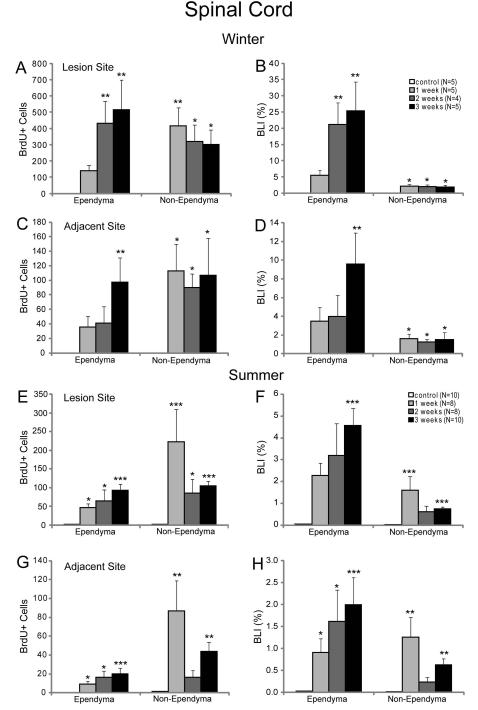
Fig. 4. Time course of BrdU labeling after spinal cord transection in winter and summer.
Graphs A, C, E and G show the number of BrdU-labeled cells (mean ± SEM) per mm length of spinal cord. Graphs B, D, F and H show the BLI (mean ± SEM), which is the percent of cells that are labeled. This is calculated as (BrdU-labeled cells) ×100 ÷ (labeled + unlabeled cells). A and B are in the lesion of animals transected in winter, while C and D are in the adjacent spinal cord of winter animals. Frames E-H are comparable data for summer animals. There was no BrdU labeling in the spinal cord of the winter control animals but some labeling in summer. BrdU labeling was dramatically induced by spinal cord transection. There was more BrdU labeling in the lesion site than in the adjacent spinal cord, and the highest rates of BrdU labeling occurred in the ependymal zone. Statistical significance compared to control (Kruskal-Wallis one-way ANOVA followed by Dunnett’s test for multiple comparisons) * p≤0.05; ** p≤0.01; *** p≤0.001. N’s in B are the number of animals used in A-D. N’s in F are the numbers of animals used in E-H. The greater availability of animals in summer than in winter resulted in higher N values and greater calculated statistical significances than seen in the winter data.

