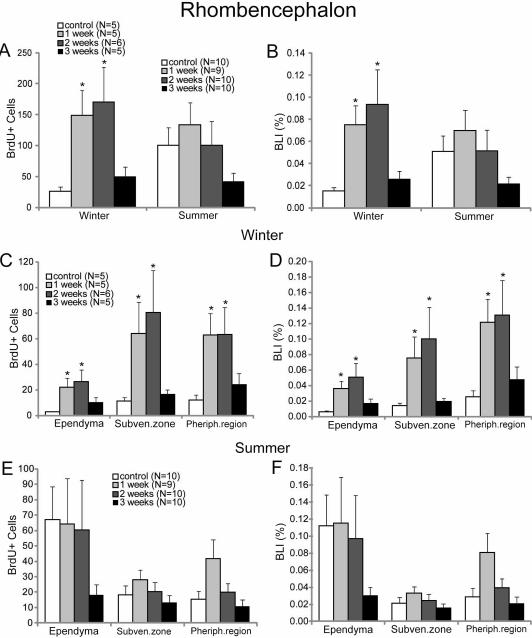
Fig. 6. Regional distribution of BrdU labeling in the rhombencephalon.
Graphs A, C and E show the number of BrdU-labeled cells in the whole rhombencephalon (mean ± SEM). Graphs B, D, and F give the BLIs for cells of the rhombencephalon as in figure 5. A and B show the data for all cells in winter and summer. C and D give data by zone for winter animals, while E and F give analogous data for summer animals. * = statistically significant (p<0.05; Kruskal-Wallis one-way ANOVA followed by Dunnett’s test for multiple comparisons). N’s shown in A are the number of animals used in winter and summer in A and B. N’s in C are the number of animals used in C and D. N’s in E are the numbers of animals used in E and F.

