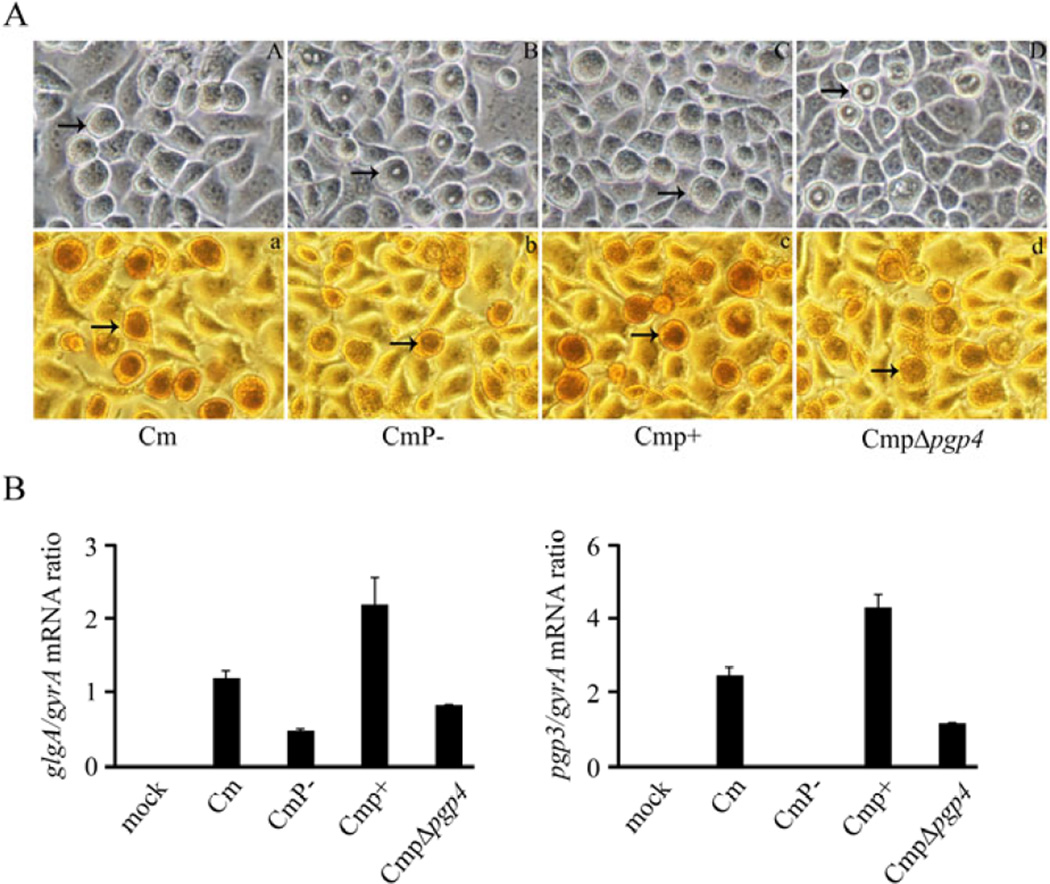
Fig. 2.
Glycogen staining and qRT-PCR analysis of C. muridarum plasmid gene mutants. (A) Phase microscopy and iodine staining of McCoy cells infected with Cm, CmP−, Cmp+ and CmpΔpgp4. Cells were infected with a MOI of 0.25 and examined at 30 h post-infection (magnification 200×). Arrows indicate inclusions. (A, a) Cm. (B, b) CmP−. (C, c) CmP+. (D, d) CmpΔpgp4. The inclusions of CmP− and CmpΔpgp4 exhibit a donut-like appearance and exhibited reduced glycogen staining. (B) glgA and pgp3 transcript levels in C. muridarum strains. The differences in glgA expression is significantly different (p<0.05) in CmP− vs Cm and CmpΔpgp4 vs Cmp+ comparisons. The differences in pgp3 expression is significantly different (p<0.05) in CmP− vs Cm and CmpΔpgp4 vs Cmp+ comparisons.

