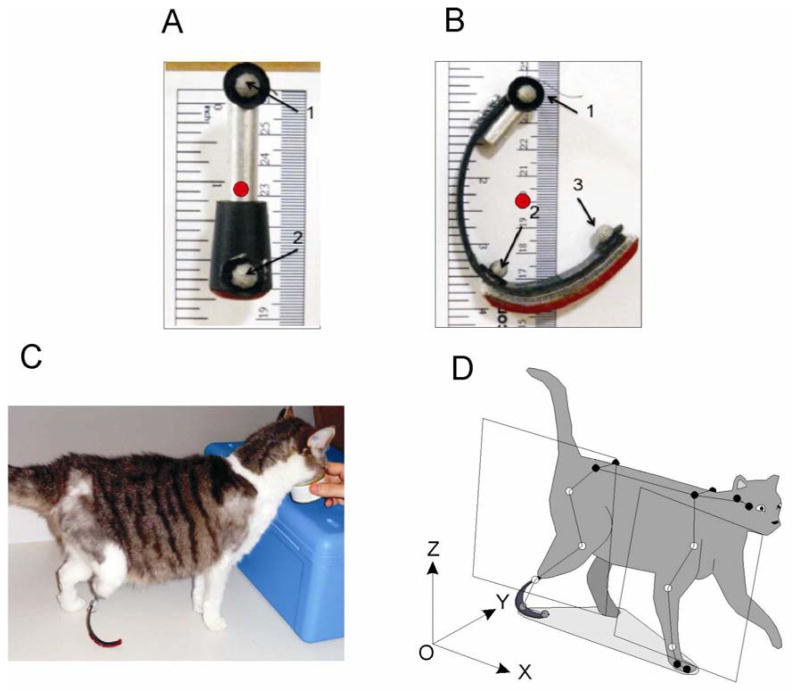
Figure 2.
Prosthetic design and cat model for motion analysis. A, B: Standing and walking prosthesis, respectively. Gray circles indicate marker placement on prostheses (marker 1 approximates location of the ankle center in the intact leg; marker 2, MTP joint; and marker 3, tip of the 5th digit). Red circles indicate center of mass of prosthesis. C: Standing on a walking prosthesis. D: A full-body cat model for motion analysis. The limb plane was defined for hind- and forelimbs using 3 markers on each limb (open markers; see text for further explanations).

