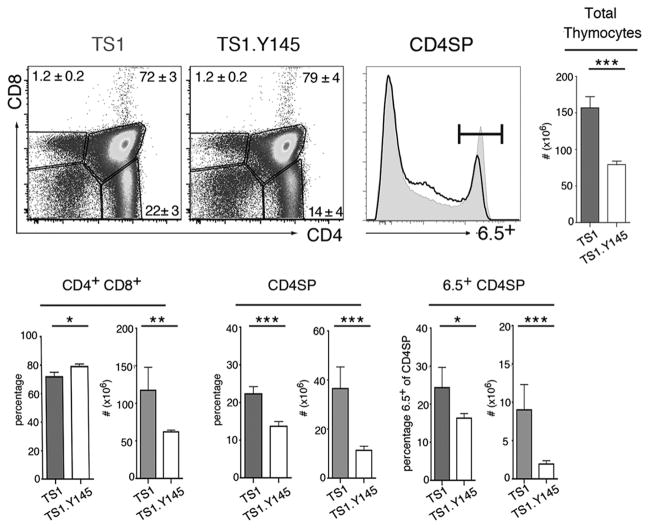
Figure 3. SLP-76 mutation alters positive selection of thymocytes expressing the 6.5 TCR.
Dot plots show staining for CD4 and CD8 of thymocytes from TS1 and TS1.Y145 mice. Histograms show 6.5 expression by CD4SP thymocytes from TS1 (gray shading) and TS1.Y145 (line) mice. Bar graphs indicate mean numbers or percentages of indicated populations ± SD (filled bars, TS1 mice; open bars, TS1.Y145 mice). *p<0.05, **p<0.01, ***p<0.001. Data are representative of at least 5 independent determinations.

