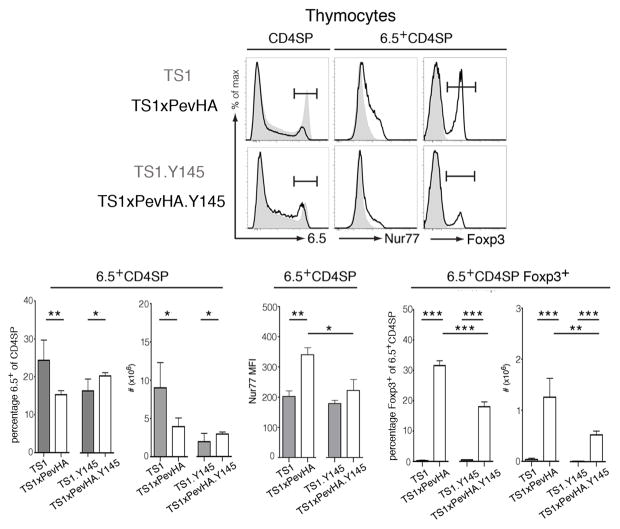
Figure 5. Attenuated TCR signaling differentially affects autoreactive thymocyte deletion and Treg formation.
Representative histograms show staining for 6.5 by CD4SP thymocytes, and of Nur77 and Foxp3 by 6.5+CD4SP thymocytes of indicated strains. Shaded histograms are for TS1 and TS1.Y145 mice, lines are for TS1xPevHA and TS1xPevHA.Y145 mice as indicated. Bar graphs indicate mean numbers or percentages of indicated populations ± SD (filled bars, TS1xPevHA mice; open bars, TS1xPevHA.Y145 mice). *p<0.05, **p<0.01, ***p<0.001. Data are representative of at least 5 independent determinations.

