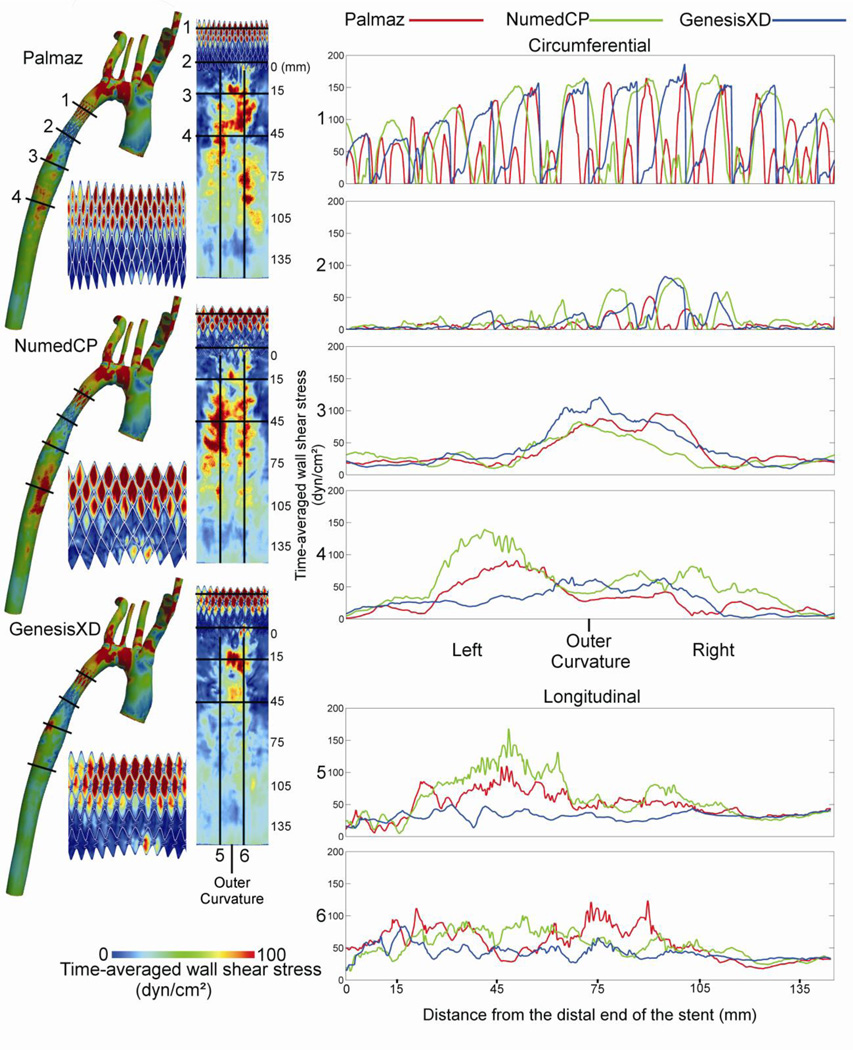
Figure 4.
Distributions of time-averaged wall shear stress for the Palmaz, NumedCP, and GenesisXD stents. CFD results for the full model are shown next to spatial maps that have been unwrapped about the outer (posterior) surface for the stented region and the distal descending aorta. Circumferential and longitudinal plots are also shown at several locations: proximal stented region (1), distal stented region (2), 15 mm distal to the stent (3), 45 mm distal to the stent (4), as well as the left (5) and right (6) portions of the outer curvature. Note that values occurring atop stent struts have been removed to improve the legibility of plots.

