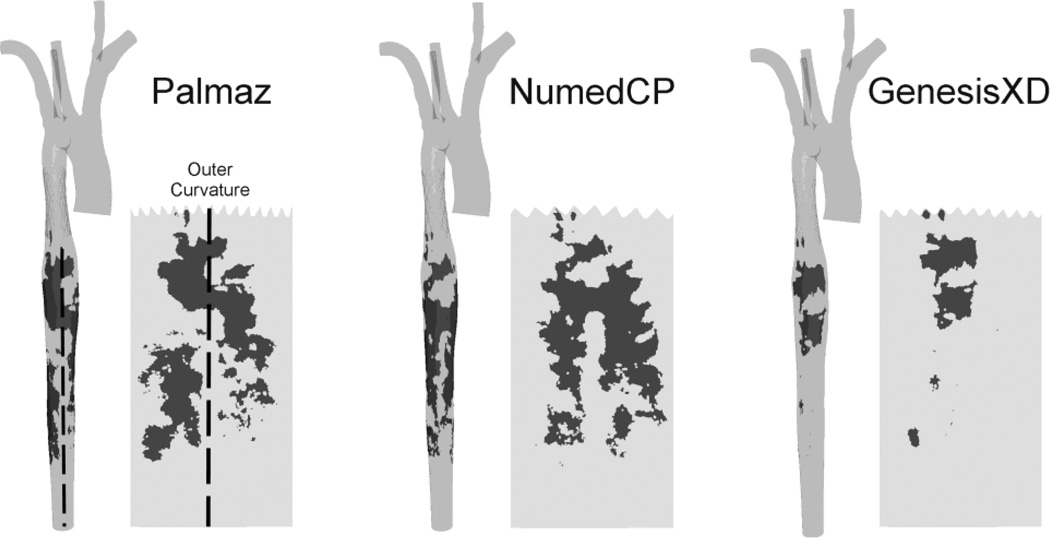
Figure 5.
Locations of elevated time-averaged wall shear stress for the Palmaz, NumedCP, and GenesisXD stents. The full CFD model results are shown next to spatial maps that have been unwrapped about the outer (posterior) surface for the descending aorta distal to the stent. Regions with time-averaged wall shear stress above 50 dyn/cm2 have been made opaque. Values above this threshold have been previously correlated with platelet aggregation.

