Figure 5.

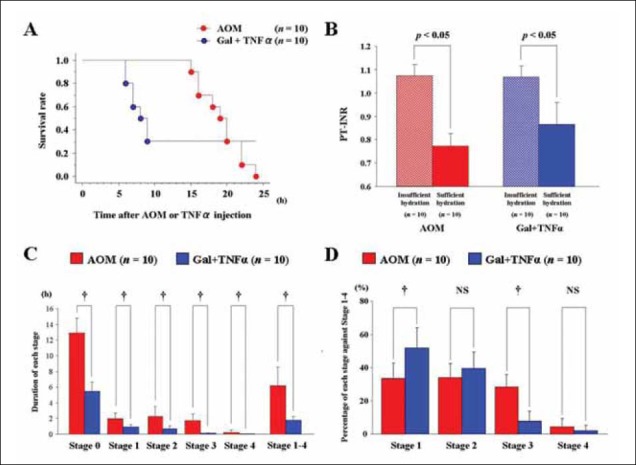
Survival curves, effects of hydration on coagulation profiles and differences in the intervals of coma stages between fulminant liver failure (FLF) models. A. Survival curves after azoxymethane (AOM) or galactosamine (Gal) + tumor necrosis factor (TNF)αinjection with body temperature (BT) care. Our laboratory used doses of 100 µg/g bw for AOM and 0.10 µg/g bw for TNFα, with routine BT care (n = 10 for both groups). B. Effects of hydration on coagulation profile. Mice PT-INR was investigated after AOM or Gal+TNFα injection with BT care. Mice were classified into two groups; mice with and without sufficient hydration (n = 10 for both groups); sufficient hydration was defined as hydration supplements (lactated Ringer’s solution, 0.5 mL/mouse, i.p) hourly from 6 h after AOM injections and from 2 h after TNFα injections. Insufficient hydration was defined as hydration supplements were given every 4 h after AOM or Gal+TNFα injections. Blood samples were taken at death or 30 h after initial injection. C. Durations of each coma stage in FLF models. The durations of each coma stage were measured in mice after AOM or Gal+TNFα injections with BT care (n = 10 for both groups). D. Length of each stage as a percentage of total stage-1-4 time. The period between stages 1-4 was considered to be the diseased state; lengths of each stage as a percentage of the diseased state were calculated in the mice after AOM or Gal+TNFα injections with BT care (n = 10 for both groups).
bw, body weight; NS, not significant
