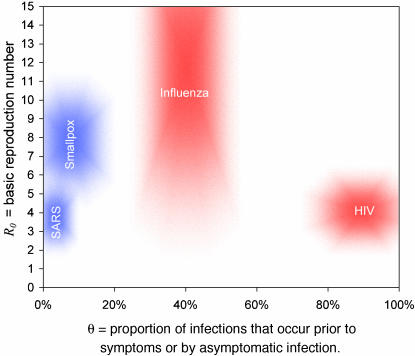
Fig. 2.
Parameter estimates. Plausible ranges for the key parameters R0 and θ (see main text for sources) for four viral infections of public concern are shown as shaded regions. The size of the shaded area reflects the uncertainties in the parameter estimates. The areas are color-coded to match the assumed variance values for β(τ) and S(τ) of Fig. 1 appropriate for each disease, for reasons that are apparent in Fig. 3.

