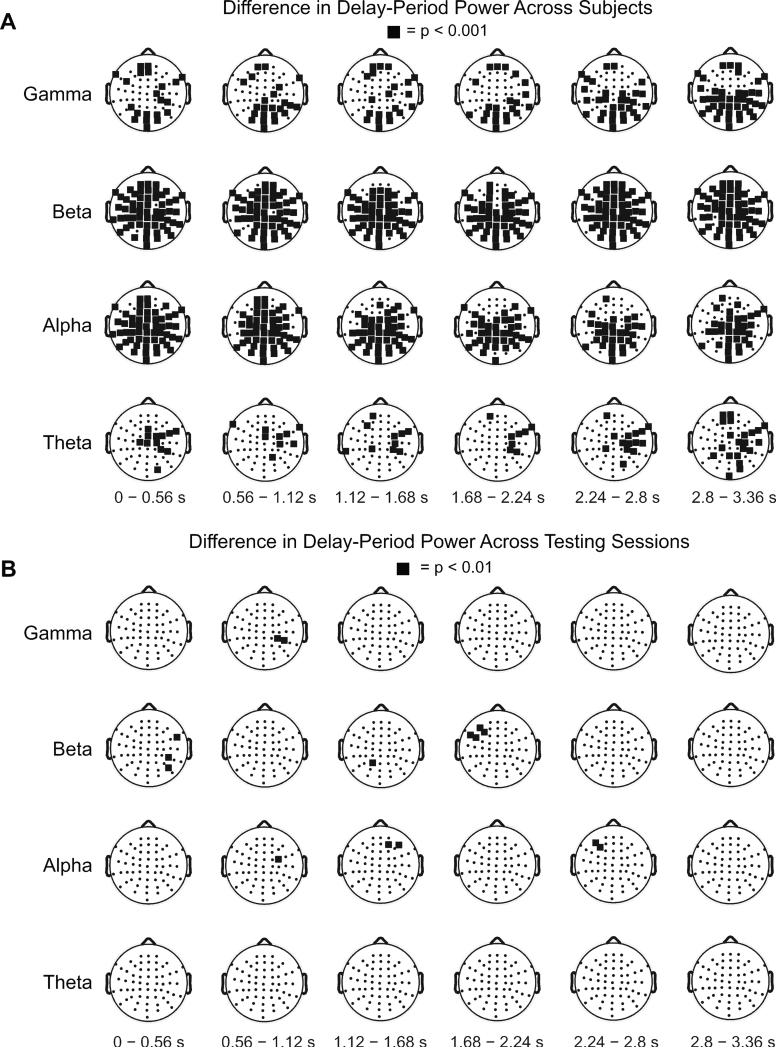
Figure 3. SPDPA varies between individuals but is stable over time, group-level analysis.
Topographical plots showing results of cluster analyses comparing delay-period spectral power between- and within- subjects. In each plot, black squares highlight electrodes exhibiting significant differences in delay-period spectral power. (A) Illustrates differences between the 16 subjects participating in (Study 1); (B) illustrates within-subject differences from five of these original subjects, plus five additional, who performed the STM task on two separate occasions, thereby giving an empirical estimate of test-retest reliability (Study 2).

