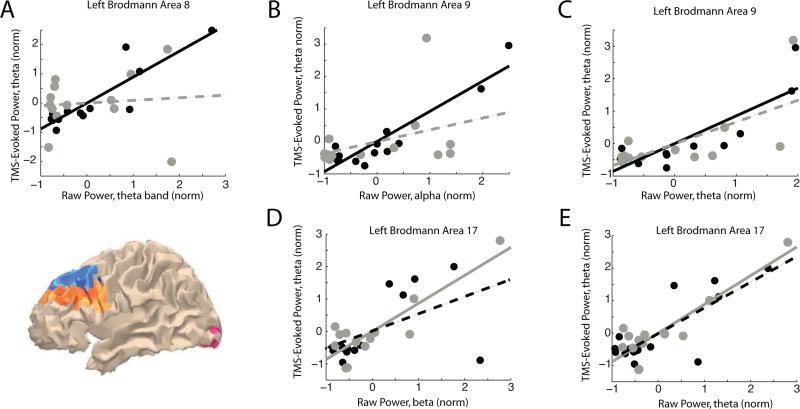
Figure 4. Correlation between spectral profiles of the TMS-ER and SPDPA during either STM TMSoff or fixation TMSoff.
Solid lines illustrate regression lines for significant correlations (corrected for multiple comparisons), and dashed lines show non-significant linear trends. Note that, with the exception of BA 8, these effects are highly similar across conditions. Black: individual subject data during STM. Gray: individual subject data during fixation. All correlations coefficients and associated p-values found in Table 1. Inset MNI brain shows spatial extent of BAs with significant correlations; BA 9 in orange, BA 8 in blue, and BA 17 in pink.

