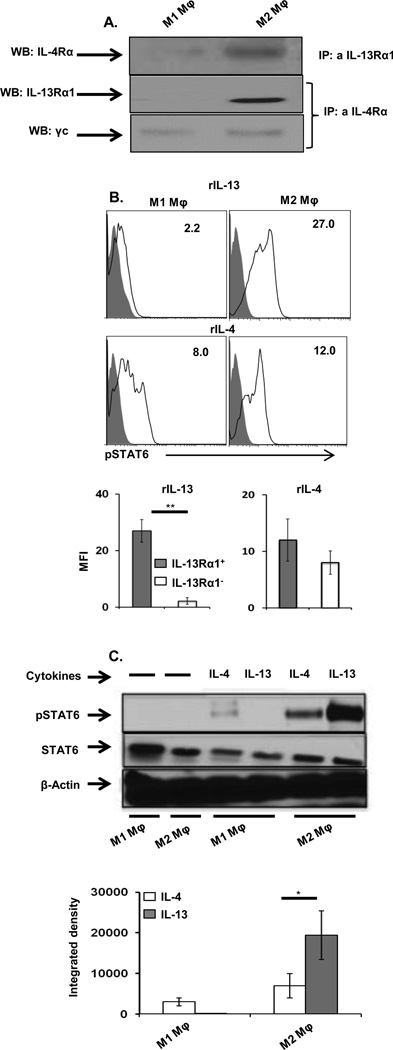
Figure 6.
STAT6 phosphorylation is greater in IL-13Rα1+ than in IL-13Rα1− (A) Purified CD11b+F4/80+IL-13Rα1− (M1 macrophages) and CD11b+F4/80+IL-13Rα1+ (M2 macrophages) macrophages were lysed and immunoprecipitation of IL-4Rα by anti- IL-13Rα1 antibody was performed (top). The middle and bottom lanes show immunoprecipitation of IL-13Rα1 and the common gamma chain (γc) by anti-IL-4Rα antibody, respectively. Experiment was repeated 2 times with similar results. . (B) Purified M1 and M2 Macrophage (5 × 10⁴/well) were stimulated with recombinant murine IL-4 or IL-13 (30 ng/mL) or medium alone for 30 minutes and phosphorylation of STAT6 was determined by (B) intracellular staining with an anti-pY641STAT6 antibody for cytokine stimulated cells (open histogram) compared with to cells that were cultured with media alone (closed histogram). The number in the upper right corner indicates the MFI of phosphorylated STAT6. The bar graphs show mean ± SEM of compiled MFI results from 3 samples in 3 independent experiments. (C) Purified M1 and M2 Macrophage were stimulated as in (B) and STAT6 phosphorylation was determined by western blot. The top panel shows a representative blot depicting phosphorylated (top) and unphosphorylated (middle) STAT6 as well as the control β-actin (bottom). The bottom panel shows the mean ± SD of integrated density for the phosphorylated STAT6 bands using data from 3 samples. The results are representative of 2 independent experiments. *p < 0.05, **p < 0.005 (unpaired two-tailed student t test).

