Figure 3.
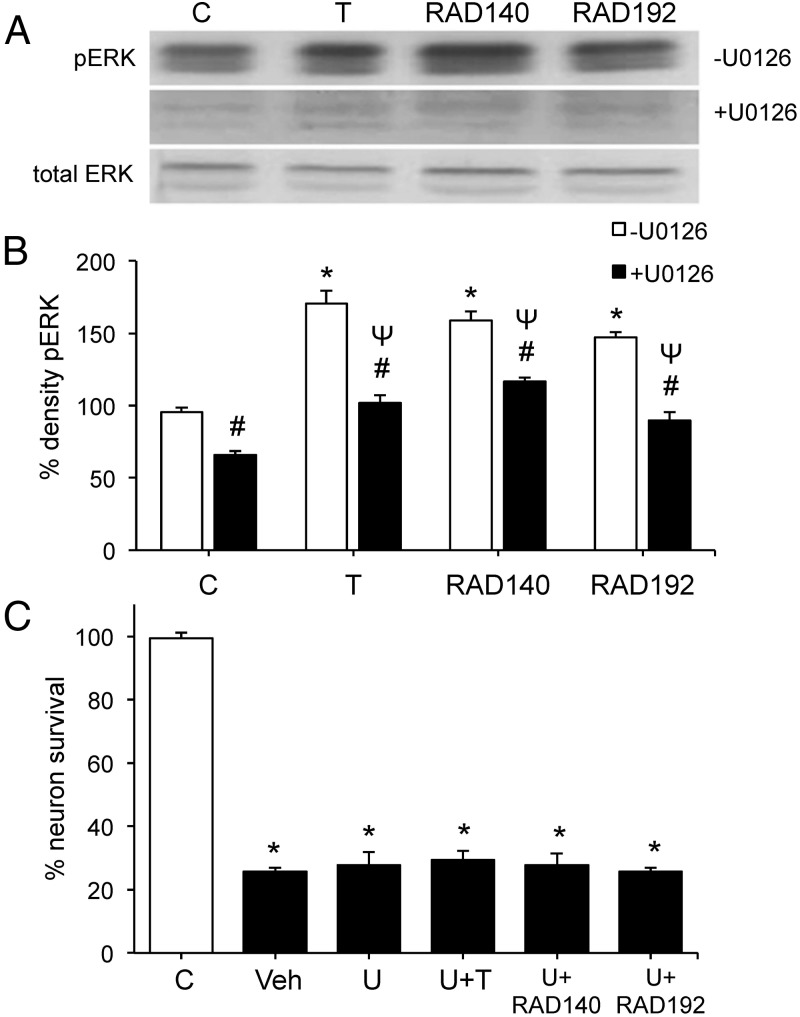
Quantitative analyses of MAPK signaling in SARM neuroprotection. A, Pretreatment of cultures with vehicle (top panel) or 10 μM U0126 (middle panel) for 2 hours was followed by exposure to 10 nM T, 100 nM RAD140, or 100 nM RAD192 for 15 minutes, and then examined by Western blot using phosphorylated (top and middle panel) and total (bottom panel) ERK-1/2 antibodies. B, The graph shows the percent phospho-ERK (pERK) expressed as a ratio between phosphorylated to total ERK-1 (44 kDa), normalized to the vehicle-treated control condition. C, Following a 2-hour pretreatment with vehicle or 10 μM of MEK inhibitor U0126 (U), cultures were exposed to 10 nM T, 100 nM RAD140, or 100 nM RAD192 for 1 hour and then treated with 50 μM Aβ1–42 for 24 hours. Cell viability data show mean (± SEM) counts of viable neurons plotted as percentage vehicle-treated control (C, open bar). *, P < .0001 relative to vehicle control (C, open bar); #, P ≤ .001 between each vehicle and the corresponding U0126 treatments (open bar vs solid bars); Ψ, P < .01 relative to U0126-treated control (C, solid bar); n ≥ 3. Veh, vehicle.

