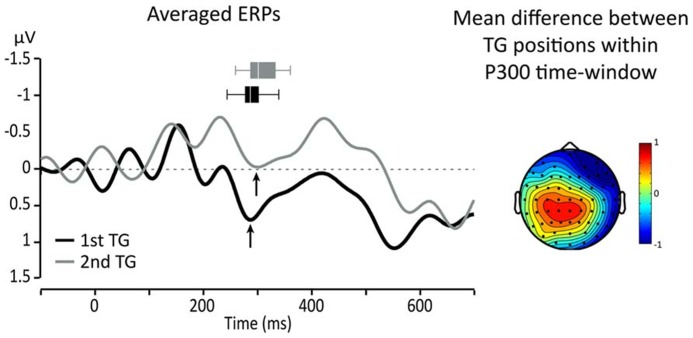
FIGURE 3.
Left: averaged responses for centro-parietal ROI: black line = first TG, gray line = second TG. Arrows indicate the peak of the P300 and horizontal box plots represent peak latency dispersion among participants. Right: topography of the average difference between ERPs for targets from TGs in first and second positions in the utterance.

