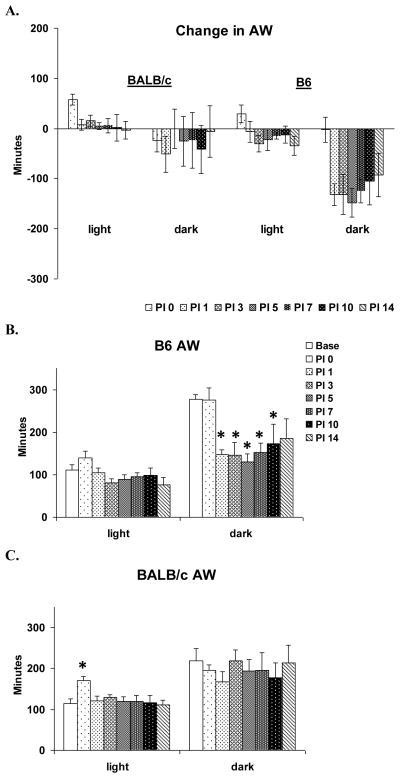
Figure 6.
Effects of VSV infection on active wakefulness (AW) during baseline (Base, open bar) and PI days 0, 1, 3, 5, 7, 10 and 14 (shaded bars). Values (mean ± SEM) are plotted for 12-h light and dark periods. (A) Direct strain comparison of VSV-induced changes in AW between BALB/c and B. Data from each animal were normalized by subtracting baseline values from post-VSV infection values and averaged by strains. (B) Total time spent in AW of B6 mice. (C) Total time spent in AW of BALB/c mice. * denotes p < 0.05 relative to the baseline values at the comparable time point.

