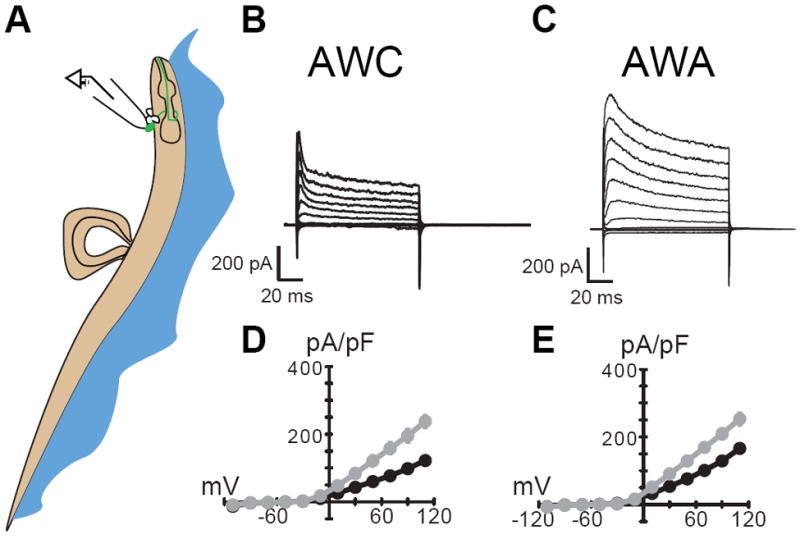
Figure 3. Voltage-activated currents in AWC and AWA chemosensory neurons.

Schematic of recording from identified C. elegans neurons in the anterior ganglion (A) and voltage-activated currents recorded from the AWCON (B) and AWA (C) neurons. Traces in panels B and C are the response to a family of voltage pulses between -110 and +100 mV (in 20 mV) increments from a holding potential of -60 mV. Current-voltage curves are the average of 5 and 8 recordings; gray and black symbols are the mean of the peak and steady-state current, respectively. Error bars (±sem) are smaller than the symbols. Data for AWC reprinted with permission (Ramot et al., 2008). All recordings used solutions as described (Ramot et al., 2008).
