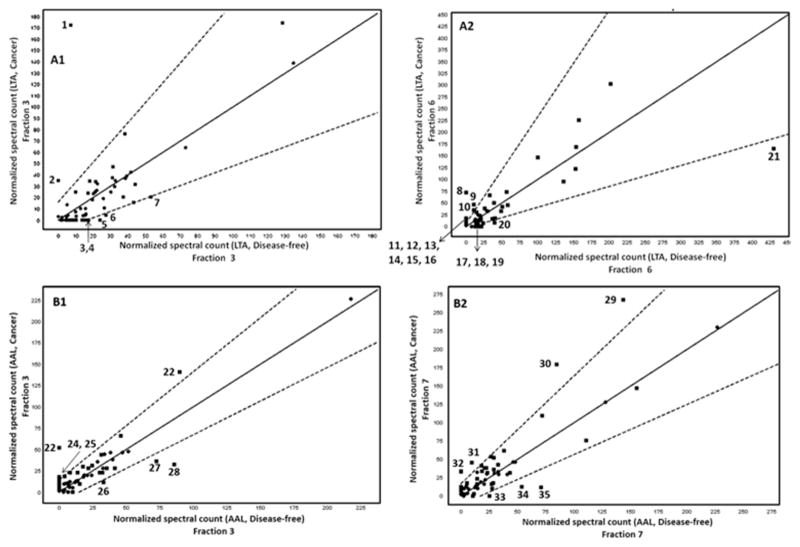
Figure 4.
Representative Q-Q scatterplots for the identification of DEPs. The squares that plot outside the dotted lines are more than two standard deviations away from being the same in both categories. The dotted lines delimit the upper and lower error bars. A1 and A2: Q-Q scatterplots for fractions 3 and 4 from RPC fractionation from LTA column; B1 and B2: Q-Q scatterplots for fractions 3 and 7 from RPC fractionation from AAL column. The DEPs in each of the scatterplots have been marked using numbers (1, 2, 3 etc.). The DEPs in A1 are as follows: 1, C4b-binding protein alpha chain; 2, C4b-binding protein beta chain; 3, apolipoprotein C-III; 4, nucleobindin-1; 5, haptoglobin-related protein; 6, alpha-1-antitrypsin; 7, complement C3. The DEPs in A2 are: 8, C4b-binding protein alpha chain; 9, inter-alpha-trypsin inhibitor heavy chain H4; 10, fibulin-1; 11, thrombospondin-1; 12, extracellular matrix protein 1; 13, pregnancy zone protein; 14, CD5 antigen-like; 15, coagulation factor V; 16, EGF-containing fibulin-like extracellular matrix protein 1; 17, angiotensinogen; 18, afamin; 19, complement C5; 20, alpha-1-antitrypsin; 21, alpha-1-antichymotrypsin. The DEPs in B1 are: 22, Vitronectin; 23, C4b-binding protein alpha chain; 24, von Willebrand factor; 25, apolipoprotein A-II; 26, complement component C6; 27, haptoglobin; 28, complement C3. The DEPs in B2 are: 29, fibronectin; 30, apolipoprotein A-I; 31, von Willebrand factor; 32, thrombospondin-1; 33, hornerin; 34, apolipoprotein B-100; 35, complement C5.

