
Figure 2.
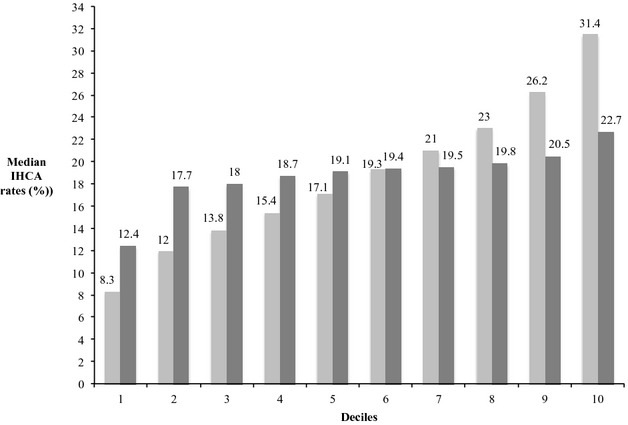
Unadjusted and adjusted median in‐hospital cardiac survival rates by hospital decile. This figure illustrates in‐hospital cardiac arrest (IHCA) rates (y‐axis) across hospitals. Median unadjusted rates are light gray bars and adjusted rates are dark gray bars. Hospital deciles are on the x‐axis. Rates are adjusted for the patient‐level factors identified in Table 1.