
Figure 1.
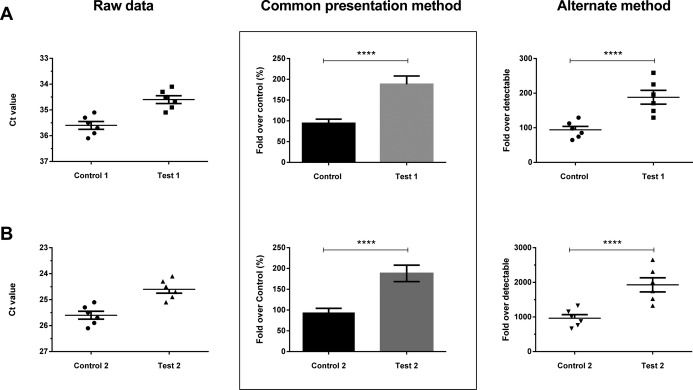
Two theoretical data sets (A and B) plotted as raw data/cycle‐threshold (Ct) values (left panel), fold over control (center panel) and fold over detectable (right panel). See text for details on the Data Presentation methods and flaws in clarity of presentation for the most popular (fold‐over‐control) method.