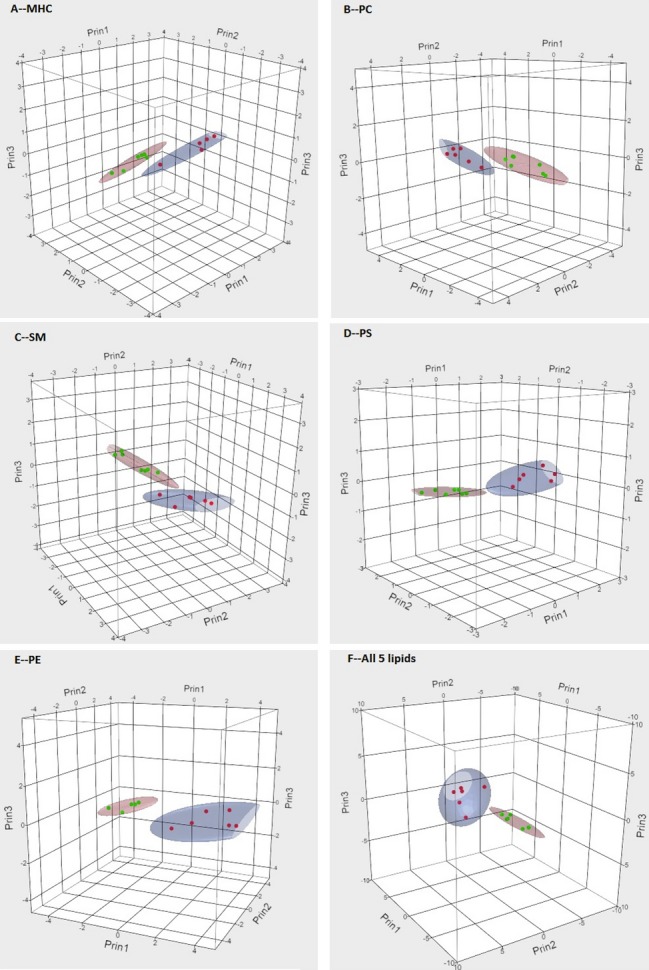
Figure 3.

3D scatter plot and 90% coverage contour ellipsoids of Fabry and high globotriaosylceramide (Gb3) heart disease patients in spaces spanned by top 3 principal components of (A) MHC, (B) PC, (C) SM, (D) PS, and (E) PE isoforms. Red dots represent heart disease patients with elevated urinary Gb3 and green dots patients with Fabry disease. MHC indicates monohexosylceramide; PC, phosphatidylcholine; PE, phosphatidylethanolamine; PS, phosphatidylserine; SM, sphingomyelin.
