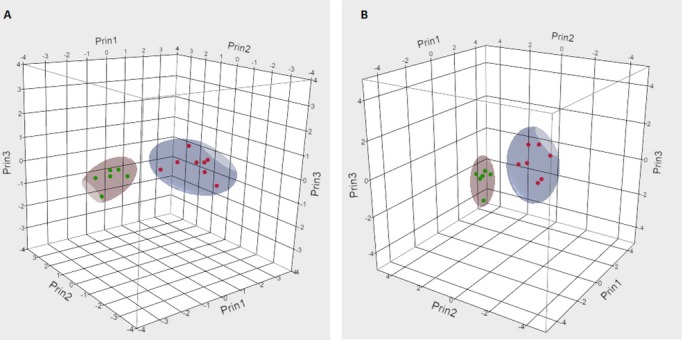
Figure 4.

3D 90% contour plots of MHC expressed as per unit of urine volume (A) or per mg of creatinine (B) of Fabry and high globotriaosylceramide (Gb3) heart disease patients. Red dots represent heart disease patients with elevated urinary Gb3 and green dots patients with Fabry disease.
