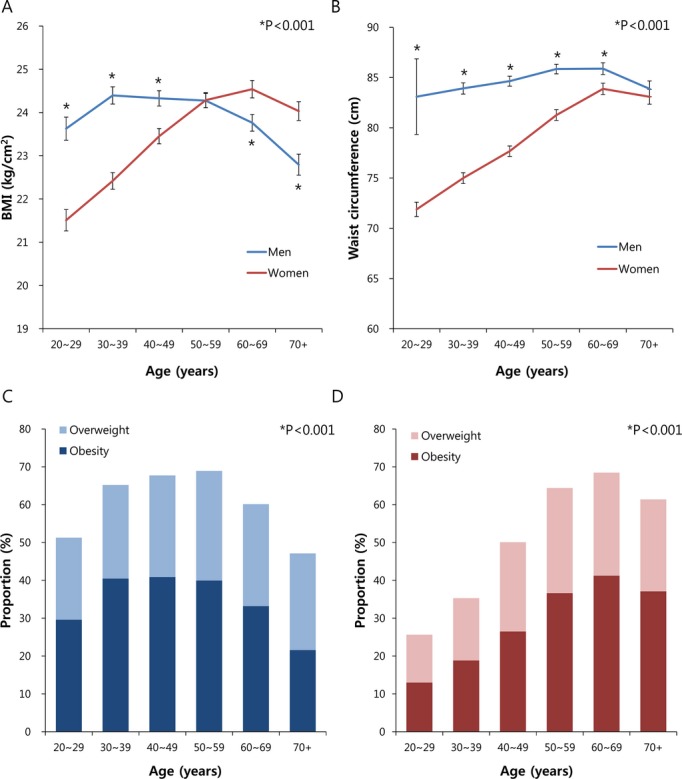
Figure 3.

Trends in obesity related parameters and prevalence of obesity in Korean subjects. A, Age‐standardized mean body mass index (BMI) in men and women. Blue line (men); red line (women). *P<0.001 for comparisons between men and women at each age group. Error bars indicate 95% confidence intervals. B, Age‐standardized mean waist circumference in men and women. Blue line (men); red line (women). *P<0.001 for comparisons between men and women at each age group. Error bars indicate 95% confidence intervals. C, Prevalence of obesity and overweight subjects in Korean men. Light blue bars (overweight, 23 kg/m2≤BMI<25 kg/m2); dark blue bars (obesity, BMI ≥25 kg/m2). *P<0.001 for comparisons among age groups. D, Prevalence of obesity and overweight subjects in Korean women. Light red bars (overweight, 23 kg/m2≤BMI<25 kg/m2); dark red bars (obesity, BMI ≥25 kg/m2). *P<0.001 for comparisons among age groups.
