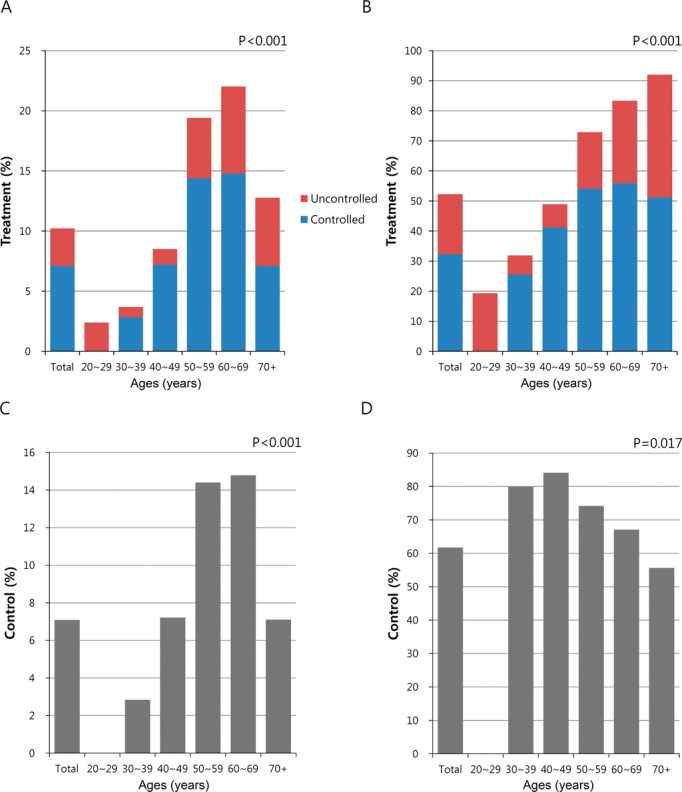
Figure 6.

Treatment and control rates of high LDL‐cholesterol among adults in the KHNANES 2008–2010 stratified by age. A, Treatment rates among all individuals with high LDL‐C. B, Treatment rates among individuals aware of their high LDL‐C. Blue bars (controlled subjects according to their individual LDL‐C goals); red bars (uncontrolled subjects according to their individual LDL‐C goals). C, Control rates among all individuals with high LDL‐C. D, Control rates among individuals treated for their high LDL‐C. KHNANES indicates Korea National Health and Nutrition Examination Survey; LDL, low‐density lipoprotein.
