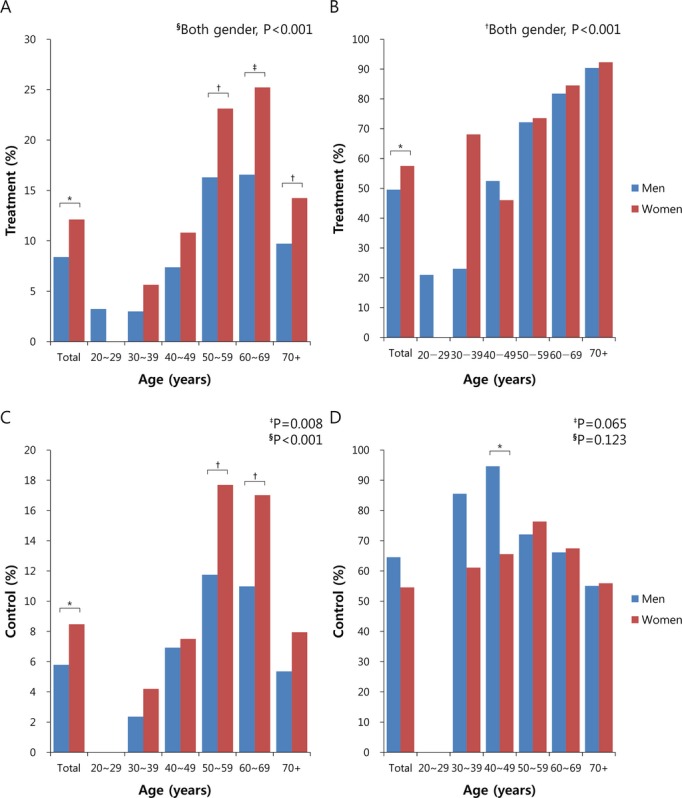
Figure 7.

Treatment and control rates of high LDL‐C among adults in the KHNANES 2008–2010 stratified by gender and age. Blue bars (men); red bars (women). A, Treatment rates among all individuals with high LDL‐C. *P<0.001, †P<0.05, and ‡P<0.01 for comparisons between men and women at a certain age group. §P<0.001 for comparisons among different age groups in the same gender. B, Treatment rates among individuals aware of their high LDL‐C. *P<0.001 for comparison between men and women. †P<0.001 for comparisons among different age groups in the same gender. C, Control rates among all individuals with high LDL‐C. *P<0.001 and †P<0.05 for comparisons between men and women at a certain age group. P‐values for comparisons among different age groups in ‡men and in §women. D, Control rates among individuals treated for their high LDL‐C. *P<0.01 for comparison between men and women at a certain age group. P‐values for comparisons among different age groups in ‡men and in §women. KHNANES indicates Korea National Health and Nutrition Examination Survey; LDL‐C, low‐density lipoprotein cholesterol.
