Abstract
Background
The mechanisms that maintain long duration ventricular fibrillation (LDVF) are unclear. The difference in distribution of the Purkinje system in dogs and pigs was explored to determine if Purkinje activation propagates to stimulate working myocardium (WM) during LDVF and WM pacing.
Methods and Results
In‐vivo extracellular recordings were made from 1044 intramural plunge and epicardial plaque electrodes in 6 pig and 6 dog hearts. Sinus activation propagated sequentially from the endocardium to the epicardium in dogs but not pigs. During epicardial pacing, activation propagated along the endocardium and traversed the LV wall almost parallel to the epicardium in dogs, but in pigs propagated away from the pacing site approximately perpendicular to the epicardium. After 1 minute of VF, activation rate near the endocardium was significantly faster than near the epicardium in dogs (P<0.01) but not pigs (P>0.05). From 2 to 10 minutes of LDVF, recordings exhibiting Purkinje activations were near the endocardium in dogs (P<0.01) but were scattered transmurally in pigs, and the WM activation rate in recordings in which Purkinje activations were present was significantly faster than the WM activation rate in recordings in which Purkinje activations were absent (P<0.01). In 10 isolated perfused dog hearts, the LV endocardium was exposed and 2 microelectrodes were inserted into Purkinje and adjacent myocardial cells. After 5 minutes of LDVF, mean Purkinje activation rate was significantly faster than mean WM activation rate (P<0.01).
Conclusion
These extracellular and intracellular findings about activation support the hypothesis that Purkinje activation propagates to stimulate WM during sinus rhythm, pacing, and LDVF.
Keywords: arrhythmia (mechanisms), long duration ventricular fibrillation, ventricular arrhythmia
Introduction
High density plunge needle(2008)–(2010) and epicardial(2004)–(2012) electrode recordings demonstrated that intramural and epicardial reentry are present during early VF but are less common after 2 minutes of VF (long duration VF, LDVF) in swine(2008),(2012) and canine(2010)–(2004) models. During LDVF, epicardial breakthrough is greater than during short duration VF.(2010) Focal activation arising in Purkinje fibers (PFs) could be a cause of this epicardial breakthrough. PFs differ from working myocytes (WMs) in many respects, such as their anatomic distribution, connexin proteins,(1993) action potentials,(1987) resting potential,(1977) sodium currents,(2008) calcium currents,(1989) Ito,(2000) Ikr, and Iks.(1998) While PFs are susceptible to the development of early and delayed after‐depolarizations and show both normal and abnormal automaticity,(2008) their role in VF maintenance is not clear. Endocardial mapping in dogs shows that activation during VF propagates from PFs to WM as well as from WM to PFs, suggesting that PFs are important in LDVF maintenance(2007) and that activation may arise focally from them.(2010),(2008) Microreentry, abnormal automaticity, and triggered activity in PFs are possible mechanisms for these foci. PFs also play a role in initiating and maintaining VT and VF in several different scenarios and have been targeted with radiofrequency ablation to treat these arrhythmias.(2002)–(2006)
PFs in the dog are in the subendocardial layer and do not course transmurally as they do in pigs.(1976) If PFs play an important role in VF maintenance, the activation patterns during VF should differ between the 2 species. Our previous studies showed that the activation patterns do differ on the epicardium during LDVF.(2012) Low density transmural recording also showed a significant activation rate gradient in dogs but not pigs during LDVF with much faster activation rates near the endocardium than near the epicardium.(2007)
In the present study, we (1) simultaneously mapped epicardial and transmural activation during sinus, pacing and VF rhythms in pigs and dogs and (2) simultaneously recorded adjacent single Purkinje and WM transmembrane potentials with microelectrodes from canine endocardium during VF. We hypothesized that if the Purkinje system plays an important role during VF, there should be more wavefronts propagating from endocardium to epicardium in dogs than in pigs, and Purkinje activation should precede or be faster than myocardial activation during LDVF.
Methods
Animals were managed in accordance with the American Heart Association guidelines on research animal use(1985) and the protocol was approved by the University of Alabama at Birmingham Institutional Animal Care and Use Committee.
Protocol 1
Animal preparation
Six pigs (41±8 kg, mean±SD) and 6 dogs (32±5 kg) were injected intramuscularly with Telazol (4.4 mg/kg), xylazine (2.2 mg/kg), and atropine (0.04 mg/kg) for anesthetic induction. Anesthesia was maintained with isoflurane in 100% oxygen by inhalation. Core body temperature, arterial blood pressure, arterial blood gases, and serum electrolytes were monitored and maintained within normal ranges throughout the study. ECG lead II was continuously displayed. The heart was exposed through a median sternotomy and supported in a pericardial sling. A plaque containing 504 electrodes (24×21) with 2 mm spacing between each electrode (Figure 1A) was sutured to the anterior lateral LV, with one edge of the plaque adjacent to the LAD (Figure 1D). Two rows of plunge needles, each with 12 electrodes 2 mm apart (Figure 1B), were inserted across one another over the midlines of the plaque, so that, together with the epicardial array, the electrodes formed 3 orthogonal planes (Figure 1C). The vertical array was a row of 24 plunge needles 2 mm apart extending from the base to the apex of the anterior LV. The horizontal array was a row of 21 plunge needles 2 mm apart placed at a right angle to the vertical array (Figure 1D). The needles were fabricated from glass‐reinforced epoxy according to a new design.(2002) The needle shafts were 0.5 mm in diameter, which is about half the diameter of traditional steel needle electrodes and minimizes damage to the myocardium.(2003) We showed in our previous publication and in the first 3 animals in this study that such a needle array does not affect VF activation patterns.(2002) A stainless steel wire was attached to the right leg as the reference electrode for the unipolar mapping electrodes. A catheter (SPRINT™ 6942 to 65 cm, Medtronic, Inc) containing a 5‐cm‐long right ventricle (RV) coil (479 mm2 surface area) and an 8‐cm‐long SVC coil (766 mm2 surface area) defibrillation electrodes were inserted into the right jugular vein. One electrode was in the right ventricular apex and the other was near the junction of the superior vena cava and the right atrium. To pace the heart, pairs of barbed silver wire electrodes insulated, except at the tips, were inserted into the LV epicardium via 21G needles. The pacing electrodes were 2 to 5 mm away from the edges of the mapping plaque (Figure 1A). After needle insertion, we waited 20 minutes to allow injury currents to subside.
Figure 1.
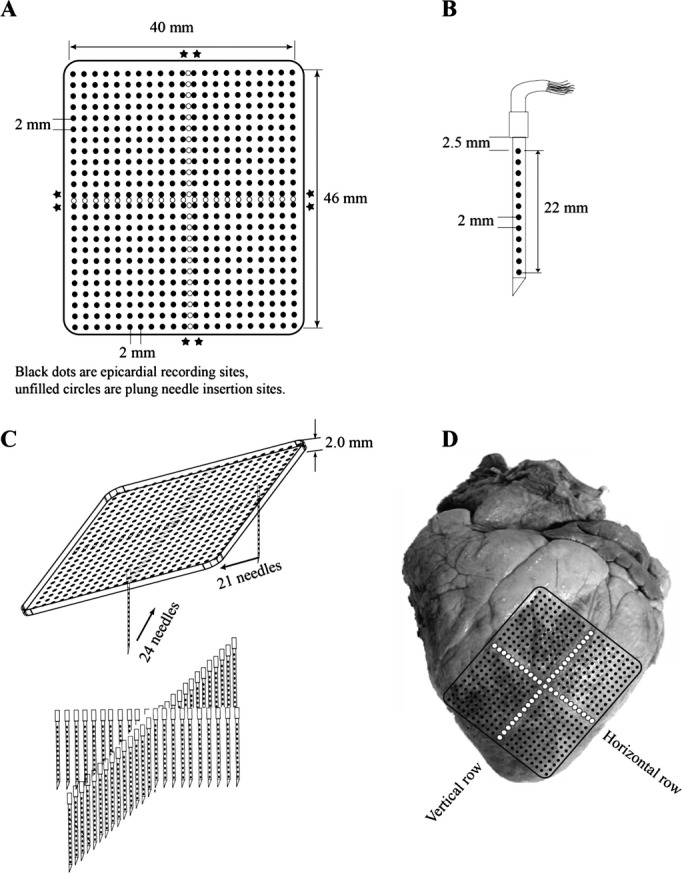
Diagram of the (A) plaque electrodes, (B) plunge needle electrodes, (C) geometry of the plaque and needle electrodes, and (D) location of the electrodes on the heart. Asterisks indicate sites of pacing electrodes.
Pacing protocol
To compare the activation sequence and conduction velocity before and after inserting each row of plunge needles, twice diastolic threshold pacing at 300, 200, 150 ms cycle lengths from the 4 edges of the epicardial array was performed after the epicardial array was sutured and repeated after the first and second row of plunge needles were inserted to detect whether they affect activation.
VF induction and rescue defibrillation
To detect whether each row of plunge needles affects activation during VF, for the first 3 animals, 6 VF episodes were induced by 60 Hz, 30 Volt AC applied briefly to the right ventricle. Two VF episodes each were induced after placing the epicardial array, the first row of plunge needles and the second row of plunge needles. The first 5 VF episodes were mapped for 20 second before being halted by a 600 V biphasic 6/4 ms shock (Ventritex HVSO2, St. Jude Medical Inc) via the catheter electrodes. The last VF episode was allowed to continue for at least 10 minutes without resuscitation. For the last 3 animals, 2 VF episodes were induced after inserting the second row of plunge needles. The first VF episode was mapped for 20 seconds before a rescue shock was given as described above. The last VF episode was allowed to continue for at least 10 minutes without resuscitation.
Quantitative Analysis of VF Activation
Quantitative analysis of VF activation patterns was performed on a Linux system computer using algorithms discussed in detail elsewhere.(1997)–(1997) We applied quantitative wavefront isolation methods to compute the following descriptors of VF activation for each 1‐second data set: (1) number of wavefronts; (2) area swept out by the wavefronts; (3) fractionation incidence; (4) collision incidence; (5) block incidence; (6) breakthrough or focal incidence; (7) multiplicity; (8) repeatability; (9) activation rate; (10) propagation velocity of the wavefronts; (11) negative peak dV/dt of VF activations; (12) incidence of re‐entry; (13) the core size; and (14) the perimeters of reentry were calculated for each 5 second data set.(1999) We calculated the activation rate from each plunge electrode for each 5‐second data set every minute after VF induction.
Identification of PF activation and location
PF activations were identified and distinguished from WM activations with an algorithm similar to that previously described.(2010),(2007) The 2‐point dV/dt was calculated as follows: [V(n+1)−V(n)]/t. PF activation was identified whenever the 2‐point dV/dt of the recordings was negative for ≤2 ms and the most negative value was ≤−0.3 mV/ms. Those electrodes with PF activations detected during sinus rhythm were used for PF analysis throughout the LDVF episode.
The thickness of both pig and dog left ventricular wall was about 2.0 to 2.4 cm in most of left ventricular free wall, which is in the range of the length of the plunge needles. Because of the trabeculae carneae and papillary muscles, the LV wall thickness is uneven. Therefore, the most distal plunge needle electrode might not reach the endocardium in the thickest wall regions. Conversely, the distal plunge needle electrodes might penetrate into the ventricular cavity in thin ventricular wall regions. After each study, we cut the heart to identify which electrodes penetrated into the ventricular cavity. During sinus rhythm and pacing, these electrodes recorded low amplitude, wide QS waves with slow downslopes, small first derivatives, and sometimes motion artifacts (Figure 2).(2010) We excluded all recordings from electrodes in the ventricular cavity from analysis.
Figure 2.
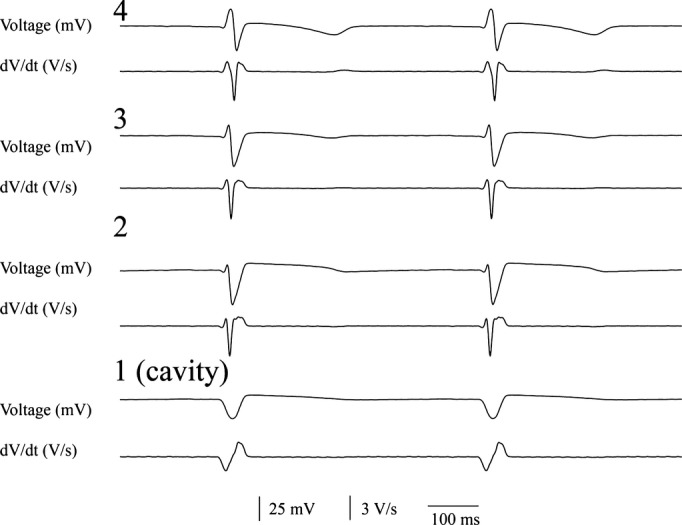
Voltage electrograms (top) and their first temporal derivative (bottom) from the 4 most distal electrodes from a plunge needle during sinus rhythm. The most distal electrode (1) was in the ventricular cavity.
We defined the region covered by the most distal 2 electrodes of each plunge needle in the ventricular wall, but not in the ventricular cavity, as the endocardial layer. The region covered by the proximal 2 electrodes (electrode numbers 11 and 12) of each plunge needle was defined as the epicardial layer, while all of the electrodes between the endocardial and epicardial layer electrodes were defined as within the mid‐myocardial layer.
Protocol 2
Animal preparation
Ten dogs (34±7 kg) were anesthetized with telazol (4.4 mg/kg), xylazine (4.4 mg/kg), and atropine (0.04 mg/kg). Anesthesia was maintained with isoflurane inhalation (1.3% to 2.5%) in O2. Heparin (500 U/kg) was given 10 minutes before heart extraction. To improve heart preservation, cold cardioplegic solution (which contained [in mmol/L] 110 NaCl, 16 KCl, 16 MgCl2, 1.2 CaCl2, and 10 NaHCO3) was infused through a needle below the clamped aorta before the heart was excised, and the coronary arteries were then flushed with cardioplegic solution immediately after the heart was removed. The left and right coronary arteries were cannulated using 2 short cannulas protruding into the arteries ≈1 mm. Hearts were perfused with Tyrode solution (containing [in mmol/L] 128.5 NaCl, 20 glucose, 4.7 KCl, 0.7 MgCl2, 0.5 NaH2PO4, 1.5 CaCl2, and 28 NaHCO3) bubbled with 95% O2 to 5% CO2 at a temperature of 37±0.5°C. The perfusion pressure was maintained at ≈70 mmHg. The heart was submerged in a warmed (37°C) and oxygenated Tyrode solution bath. The heart was defibrillated if VF was present. After cardiac excision, the left ventricular anterior papillary muscle and adjacent endocardium were exposed by an incision through the RV and septum, as described previously.(2007)
Microelectrode recordings
Glass capillary tubes were pulled to form microelectrodes that had an impedance of ≈10 MΩ when filled with 3 mol/L KCl. Two microelectrodes were used simultaneously to record transmembrane potentials from adjacent Purkinje and WM cells within ≈1 mm of each other. The microelectrode used to record the Purkinje transmembrane potential was inserted where the false tendon joined the myocardium. Each microelectrode was mounted on a motorized micromanipulator (WPI DC3001, World Precision Instruments) and was connected to the input of a differential preamplifier (WPI Duo 773 Dual Microprobe System, World Precision Instruments). A bipolar electrode electrogram was also simultaneously recorded with 1 electrode located near the microelectrode recording the Purkinje cell and another electrode located near the microelectrode recording the WM. 2, 3‐butanedione monoxime (15 mmol) was used to inhibit ventricular motion to maintain stable microelectrode recordings. The signals from the microelectrodes as well as from the bipolar electrode were simultaneously recorded with a multiple channel data acquisition system with direct current coupling after preamplification. Signals were recorded digitally with 12‐bit accuracy at a rate of 4000 samples/s and stored on 8‐mm data cartridge tapes (Exabyte Corporation) for offline analysis. VF was induced by 60 Hz, 30 V electrical stimulation. Purfusion was halted immediately after VF was induced. Recordings were made for at least 10 minutes.
The Purkinje and WM transmembrane action potentials were verified by their morphology, maximum upstroke, and activation time alignment with Purkinje and ventricular activation on the bipolar electrogram recording. In general, the PFs had longer APD50 and APD90, larger amplitude of the action potential and of the maximal rising rate of action potential upstroke compared with WM cells.(1987)–(2000)
Data Acquisition and Statistical Analysis
Results are expressed as mean±SD. The effect of plunge needles on the epicardial wavefront activation sequence recorded with the 504 electrode mapping plaque, before and after plunge needle insertion, was calculated with Pearson correlation in the first 3 pigs to test the similarity of activation sequence. The effect of plunge needles insertion on epicardial wavefront activation characteristics (Table) was compared with repeated measures ANOVA. The earliest activation sites among the 3 layers from the plunge needle recordings during sinus rhythm and pacing among pigs and dogs were compared with a Wilcoxon rank sum test. The activation times along each plunge needle during sinus rhythm were pooled in pig and dog separately and compared between pig and dog with an unpaired t test. The effect of Purkinje activation and VF time on activation rate was assessed by a 2‐factored repeated measures ANOVA (SPSS Inc). The partial η2 was calculated to estimate the amount of variance in VF activation between the electrodes with and without Purkinje activations (Protocol 1) or between Purkinje and WM cells activations (Protocol 2). Cohen's d‐values were calculated to estimate the effect sizes with data analyzed by t test. For all analyses, P<0.05 was considered statistically significant.
Table 1.
VF activation patterns before and after plunge needles insertion
| Pig (n=3) | Dog (n=3) | |||||
|---|---|---|---|---|---|---|
| Before Needles Inserted | After First Needle Row Inserted | After Second Needle Row Inserted | Before Needles Inserted | After First Needle Row Inserted | After Second Needle Row Inserted | |
| Number of wavefronts | 64±22 | 60±17 | 66±22 | 98±31 | 92±26 | 94±22 |
| Block incidence | 25±9 | 27±13 | 26±12 | 23±7 | 27±11 | 24±8 |
| Breakthrough or focal incidence | 39±12 | 35±18 | 38±12 | 22±10 | 24±11 | 19±6 |
| Multiplicity | 9.3±2.2 | 8.8±1.3 | 9.4±2.2 | 14±6.3 | 12±2.0 | 10±2.4 |
| Area swept by wavefronts, mm2 | 199±33 | 182±46 | 209±33 | 237±42 | 227±52 | 219±43 |
| Reentry incidence | 1.3±0.2 | 1.1±0.04 | 1.0±0.2 | 3.5±1.2 | 3.6±0.3 | 3.2±0.6 |
P>0.05 for pig and dog before, after the first needle row and after the second needle row insertion.
Results
One or more electrodes penetrated into the LV cavity in 24% of the plunge needles in each animal and were excluded from analysis. The tips of the needles did not penetrate into the LV cavity in 3% of the plunge needles in each animal. For these needles the 2 most distal electrodes were considered to be in the endocardial layer.
The Effect of Plunge Needles on Wavefront Propagation
As shown in Figures 3 and 4, epicardial activation sequences before and after insertion of each row of plunge needles were similar during both sinus and paced rhythm (R2=0.95 and 0.93 between no plunge needles and first row of plunge needle insertion, R2=0.93 and 0.92 between no plunge needles and second row of plunge needle insertion for sinus and pacing rhythm, respectively). During VF, insertion of each row of plunge needles did not significantly affect the number of epicardial wavefronts, conduction velocity, multiplicity, repeatability, and area activated by each wavefront (P>0.05, Table).
Figure 3.
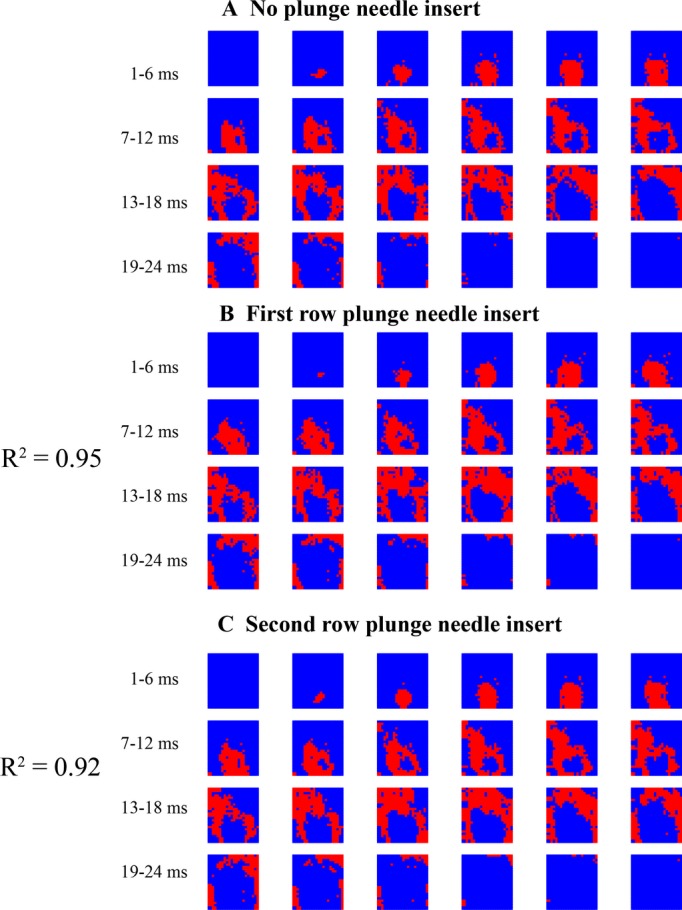
Epicardial activation during sinus rhythm in a pig. Each red colored pixel is an electrode site at which the rate of voltage change (dV/dt) is ≤−0.5 V/s sometime during the 1‐ms interval represented by each frame. The numbers show the time immediately before a sinus activation propagates into the mapped region.
Figure 4.
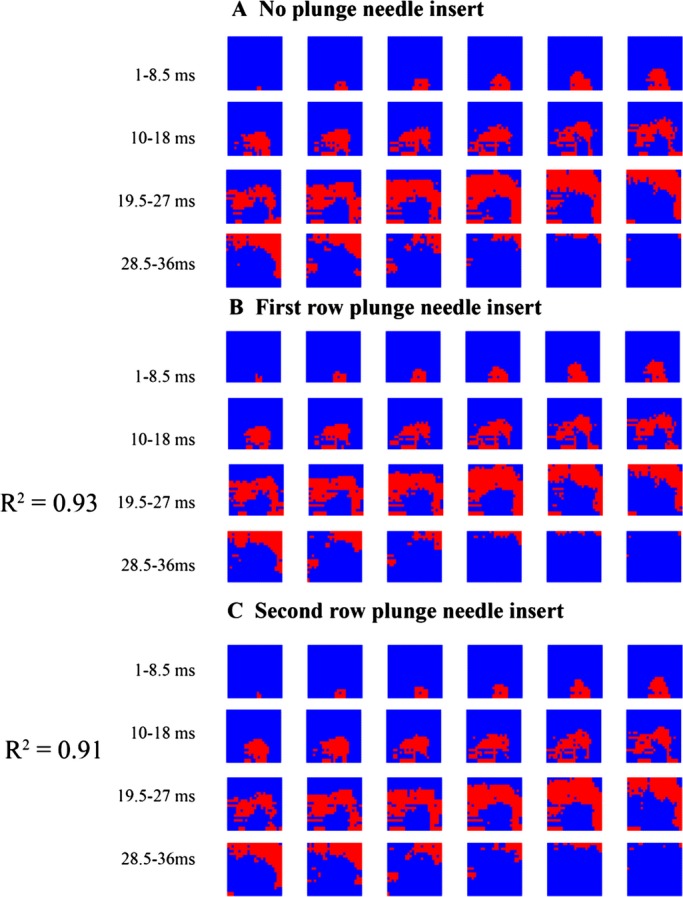
Epicardial activation during pacing from an epicardial site below the bottom edge of the mapping plaque in a pig. Each red colored pixel is an electrode site at which the rate of voltage change (dV/dt) is ≤−0.5 V/s sometime during the 1.5‐ms interval represented by each frame. The numbers show the time 2 ms after the pacing stimulus.
Transmural Activation Patterns During Sinus and Paced Rhythm
During sinus rhythm in dogs, the endocardial layer always activated earlier than the mid‐myocardial layer, and the mid‐myocardial layer always activated earlier than the epicardial layer (Figure 5A). In 79% of the needles in pigs, an electrode in the epicardial or mid‐myocardial layer was earliest (Figure 5B). Thus, sinus activation propagated sequentially from the endocardial layer to the epicardial layer in dogs but not in pigs. The median and mean time for all 12 electrodes within the LV wall to activate each of the 44 plunge needles during sinus rhythm was 7.5 and 7.6±3.0 ms in pigs and 18.5 and 18.3±5.4 ms in dogs with similar wall thickness in both species (P<0.001). Percent change of the activation rate during sinus rhythm between the 2 species was 59% with a Cohen's d‐value of 2.5. There was no significant difference in the mean activation time across the LV wall between vertical and horizontal rows of plunge needles during sinus rhythm in pigs (7.5±2.3 versus 7.6±2.5 ms, P>0.05) or dogs (18.4±4.6 versus 18.2±6.3 ms, P>0.05).
Figure 5.
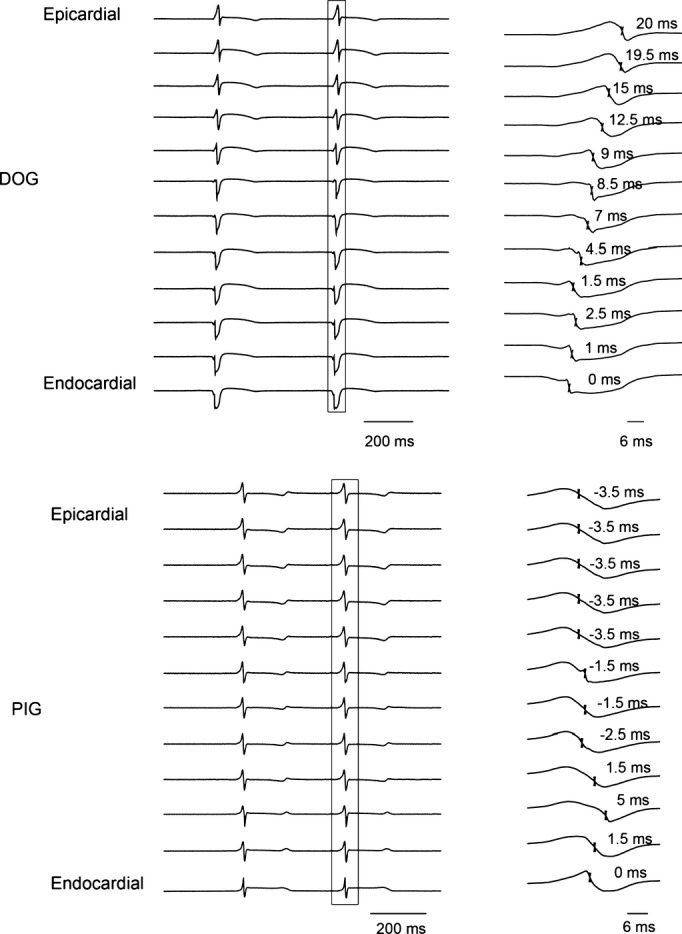
The 12 unipolar recordings from 1 plunge needle during sinus rhythm in a dog (A) and a pig (B). The activation complex within the box on the left is shown at a greater time scale on the right. The times of fastest downslope are indicated on the right with endocardial activation labeled 0 ms.
Figure 6 shows examples of the activation pattern along the transmural plane formed by a row of plunge needles in a dog and a pig during epicardial pacing at the edge of the plunge needle row. In dogs, the activation front was almost parallel to the epicardium (Figure 6A). However, in pigs, the activation front propagated away from the pacing site approximately perpendicular to the epicardium with a similar velocity in all 3 layers (Figure 6B).
Figure 6.
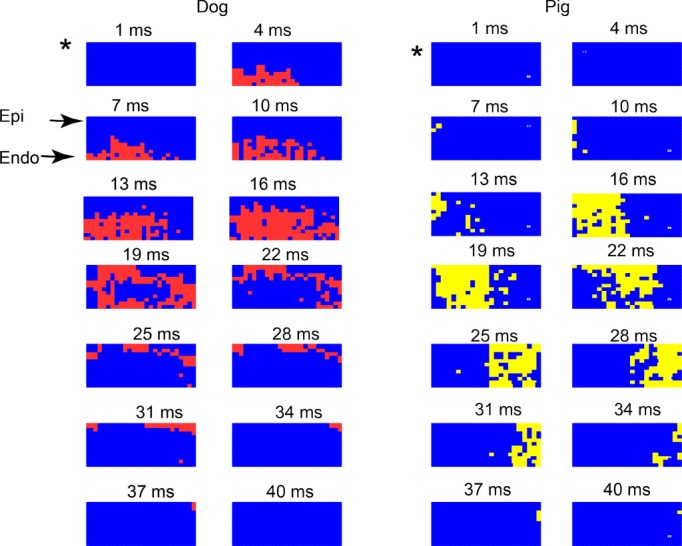
Activation during pacing from the epicardial site marked as * at the edge of a transmural plane of plunge electrodes in (A) a dog and (B) a pig. Each colored pixel (red for dog and yellow for pig) is an electrode site at which the rate of voltage change (dV/dt) is ≤−0.5 V/s sometime during the 3‐ms interval represented by each frame. The numbers show the time from the beginning of the pacing stimulus. Endo indicates endocardial most layer; Epi, epicardial most layer of electrodes. See text for detailed explanation.
Transmural Activation Rate During VF
The electrodes in epi‐, mid‐, and endocardial layers activated at a similar fast rate during the first 2 minutes after VF induction for both dogs and pigs (Figure 7). The activation rate gradually decreased as VF continued for both species. As reported previously,(2004) a transmural gradient in activation frequency occurred in dogs but not pigs after 2 minutes of LDVF (Figure 7). The canine endocardial layer activated faster than mid‐ and epicardial layers during LDVF. Conduction block was frequently observed along the plunge needles in dogs. During LDVF in pigs, fast activation occurred in all 3 layers, thus, no significant activation frequency transmural gradient was observed.
Figure 7.
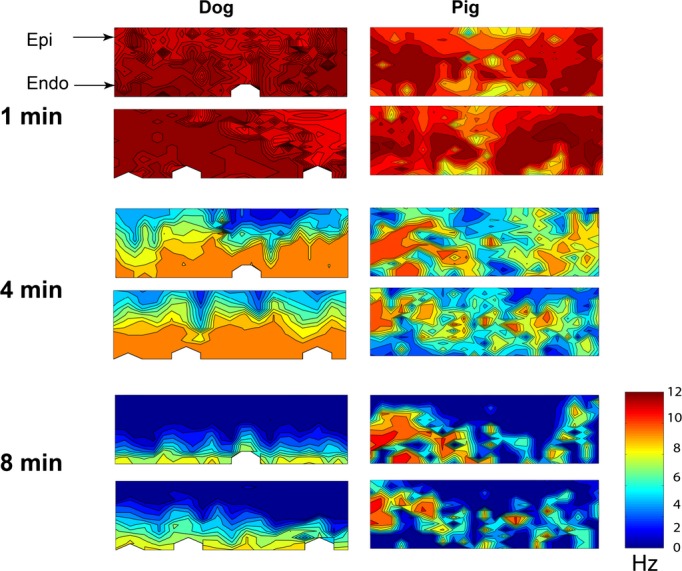
Transmural activation rate maps 1, 4, and 8 minutes after VF induction in a dog (left) and a pig (right). The top map is for the horizontal row of plunge needles and the bottom map is for the vertical row. The epicardium is at the top of each map and the endocardium is at the bottom. The color bar indicates the activation rate in Hz. After 1 minute of VF, the activation rate was similar transmurally in both species. After 4 minutes of long duration ventricular fibrillation (LDVF), fastest activation was in the endocardial layer and gradually decreased from endo‐ to epicardium in the dog, but was distributed among epicardial, mid‐, and endocardial layers in the pig. After 8 minutes of LDVF in the dog, the endocardial layer still activated while the epicardial layer was almost silent. In the pig, the fastest activation area was still scattered among the 3 layers.
The Relationship of PF and WM Activation During VF
During early VF, Purkinje activation had no fixed coupling interval with myocardial activation. Due to the lack of a diastolic interval, the algorithm had difficulty detecting Purkinje activations during the first 2 minutes of VF in either species. After 2 minutes of LDVF in dogs, Purkinje activations were recorded mainly in the endocardial layer (Figure 8A): Purkinje activation was registered in 25±6% of endocardial electrodes, but only 2±0.3% and 0±0% of midwall and epicardial electrodes, respectively (P<0.05). In contrast, after 2 minutes of LDVF in pigs, Purkinje activations were observed in all 3 layers (Figure 8B): Purkinje activation was registered in 7±4%, 13±5% and 6±3 of electrodes in porcine endo‐, mid‐, and epicardial layers, respectively (P<0.05).
Figure 8.
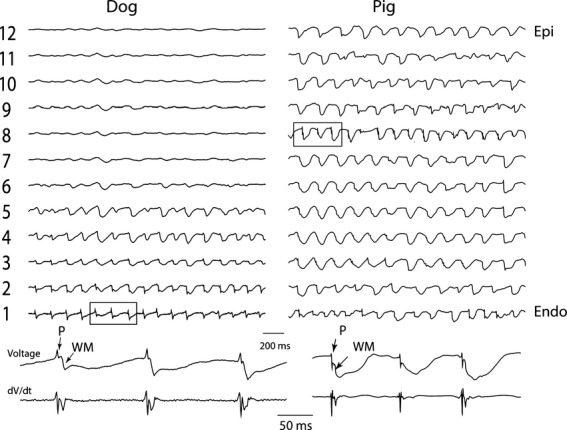
Dog and pig single plunge needle recordings during VF (top traces). Bottom 2 traces are electrograms and the first temporal derivative of the electrograms expanded from the 3 activation complexes in squares in the top traces. Endo indicates endocardial most electrode; Epi, epicardial most electrode; P, Purkinje activation; VF, ventricular fibrillation; WM, working myocardial activation.
In electrode recordings in which a one‐to‐one relationship was present between Purkinje and WM activations, in 91% of all cases Purkinje preceded WM activation (Figure 8). During LDVF, in the endocardial layer in dogs after 2 minutes of LDVF and in all ventricular electrodes in pigs after 3 minutes of LDVF, the WM activation rate in recordings in which Purkinje activations were present was usually significantly faster than the WM activation rate in recordings in which Purkinje activations were absent (P<0.001, repeated measures ANOVA, Figure 9). The ventricular activation rate recorded by electrodes with Purkinje activations declined more slowly than that recorded by electrodes without Purkinje activations for both dog (Figure 10A) and pig (Figure 10B). In dog, the effect size of activation rate for electrodes with and without Purkinje activations was 96% (estimated by η2). The effect size of activation rate decreased to 93% as VF continued. In pig, the effect size of activation rate for electrodes with and without Purkinje activations was 80% (estimated by η2). The effect size of activation rate decreased to 77% as VF continued in pigs.
Figure 9.
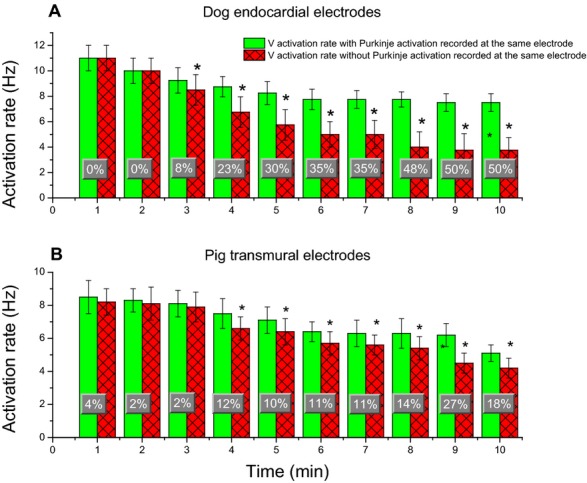
Mean and SD of WM activation rates in recordings with and without Purkinje activations every minute during VF. A, is for the most endocardial electrodes of each plunge needle in dogs. B, for all plunge needle electrodes within the ventricular wall in pigs. Percent changes of activation rate at each minute between recordings with and without Purkinje activations during VF are superimposed on the bar graphs. An asterisk indicates P<0.05 for that minute of VF. VF indicates ventricular fibrillation; WM, working myocardium.
Figure 10.
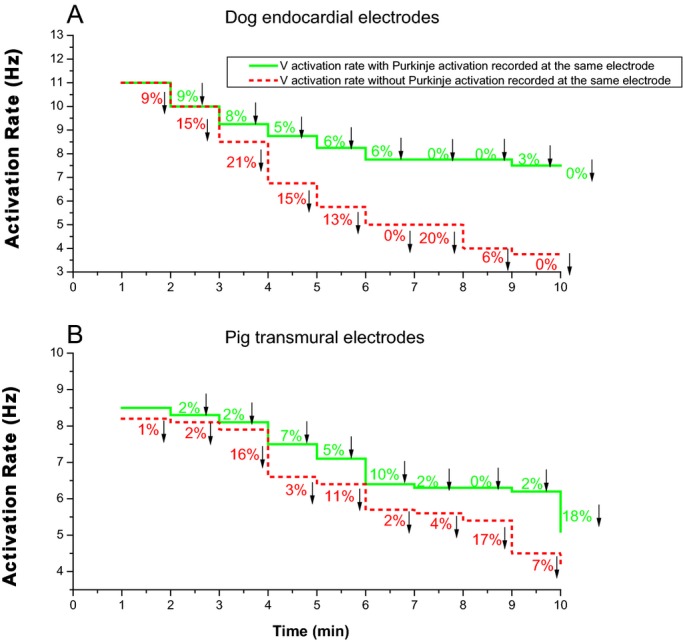
Per minute percent decreases of activation rate between recordings with and without Purkinje activation during 10 minutes of ventricular fibrillation (VF). A, for the most endocardial electrode of each plunge needle in dogs. B, for all plunge needle electrodes within the ventricular wall in pigs.
Purkinje and WM Transmembrane Potentials During VF
Figure 11 shows the Purkinje and WM transmembrane potentials recorded each minute after VF induction in a dog. The activation rate of Purkinje and WM cells was similar during the first minute of VF. The activation rate decreased as VF continued with WM cells' activation rate decreasing significantly faster than Purkinje cells after 4 minutes of LDVF. The activation rate in Purkinje cells was significantly faster than in WM cells after 4 minutes of VF for the 10 animals (repeated ANOVA, Figure 12, P<0.001). Activation rate decreased every minute over the 10 minutes of VF with the rate in WF decreasing faster than in Purkinje fibers 5 minutes after VF induction (Figure 13). The effect size of Purkinje activation rate compared to WM rate was 70% (estimated by η2). The effect size of Purkinje and WM activation rate decreased to 92% as VF continued.
Figure 11.
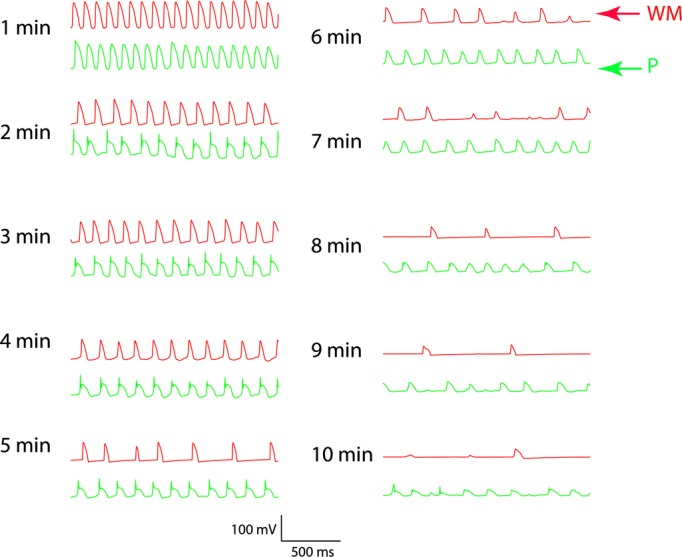
Two simultaneous microelectrode recordings every minute for 10 minutes during LDVF in a dog. The top tracing is from a microelectrode inserted into a WM. The bottom tracing is from a microelectrode inserted into a Purkinje fiber (P) at the insertion of a false tendon about 1 mm away. Between 2 and 4 minutes of LDVF, the Purkinje activation leads the WM activation in a one‐to‐one relationship. After 4 minutes of LDVF, Purkinje activations are more rapid than WM activations. LDVF indicates long duration ventricular fibrillation; WM, working myocardium.
Figure 12.
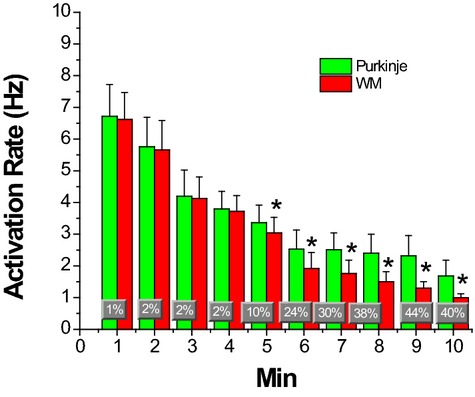
Mean and SDs of activation rates of Purkinje and WM cells during 10 minutes of LDVF. Percent changes of activation rate between Purkinje and WM are superimposed on the bar graphs. *P<0.01 vs the activation rate of Purkinje cells. LDVF indicates long duration ventricular fibrillation; WM, working myocardium.
Figure 13.
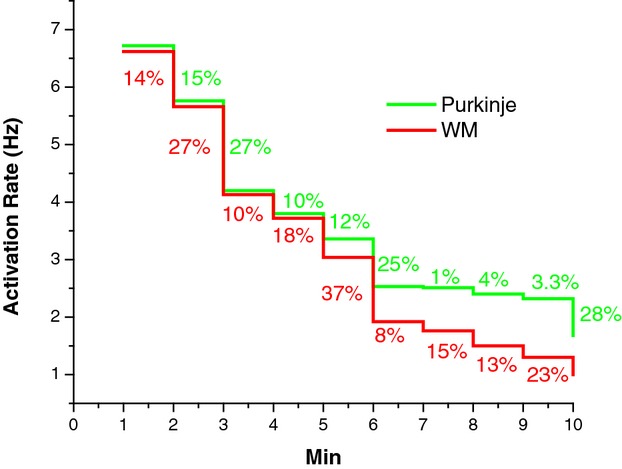
Per minute percent decrease of activation rate between recordings of Purkinje (green) and WM (red) during 10 minutes of VF. VF indicates ventricular fibrillation; WM, working myocardium.
Discussion
The main findings of this study are as follows: (1) during sinus rhythm, LV transmural activation time was much shorter in pigs than in dogs with different propagation patterns; (2) during sinus rhythm and VF, Purkinje activations were mainly recorded in the endocardial layer in dogs but were scattered transmurally in pigs; (3) during LDVF, extracellular recording sites with Purkinje activation complexes had significantly faster mean WM activation rates than extracellular sites without Purkinje activation complexes; (4) after 5 minutes of LDVF in intracellular endocardial recordings, the mean Purkinje activation rate was significantly faster than the mean WM activation rate. These findings are all consistent with the hypothesis that Purkinje activation propagates to stimulate WM activation during LDVF as well as during sinus rhythm.
Comparing the Current Study With Previous Studies
Although we have previously recorded intramural activation in pigs and dogs during VF,(2008)–(2010),(2007),(1986) the mapping resolution, the depth of the intramural recordings, or the type of electrode were not appropriate to detect most Purkinje activations and their relationship with WM activations. Allison et al(2007) studied pig and dog LDVF with 50 to 60 plunge needles 0.5 to 1.5 cm apart inserted throughout the LV‐free wall. Because of this wide spacing, the data were analyzed in only one dimension (transmurally). Also, the deepest electrode on the plunge needles was 11 mm along the direction of the needle from the epicardium, which may not have been deep enough to reach the endocardium to detect Purkinje activations in dogs, which were only rarely seen in that study. Although, Li et al(2008) used a template to guide insertion of 81 plunge needles with 2 mm spacing between needles, which allowed mapping of 3‐D intramural activation sequences, once again, the deepest electrode was 10 mm along the needle from the epicardium, which may not have been deep enough to reach the endocardium. Although, Worley et al recorded 0.15 mm away from the endocardium with plunge needles anchored to the endocardium, bipolar electrodes were used in which the distance between the poles was only 0.5 mm, which was probably too close to record Purkinje activation unless it was immediately adjacent to the electrode.(1986) To overcome these limitations for the current study, we recorded unipolar activations with closely spaced, longer plunge needles in which the deepest electrode was 22 mm from the epicardium along the shaft. This was sufficiently long that 97% of the needles protruded into the LV cavity and the deepest electrode was in the LV cavity for 24% of the needles.
The 2 crossed rows of plunge needles allowed us to analyze activation in 2 transmural dimensions. Compared with the 9×9×9 electrode matrix, the 2 crossed rows of plunge needles reduced the local density of plunges and hence reduced the damage caused by insertion of the plunge needles. Combining the information from the 2 crossed transmural mapping arrays and from the epicardial plaque, we confirmed that the 2 crossed rows of plunge needles did not significantly alter the epicardial electrophysiological features of sinus rhythm, paced rhythm, and LDVF.
Distribution of Purkinje Activations and Their Relationship With WM Activations
As the last ramifications of the special conduction system, the Purkinje network transmits the electrical impulse to the WM during sinus rhythm. Because Purkinje fibers are electrically isolated from WM except at their terminations at Purkinje ventricular muscle junctions (PVJs), during sinus rhythm and during pacing in the specialized conduction system, there is a short time interval, ie, the PF‐WM interval, between Purkinje activation and the subsequent WM activation in the same electrode recording, which is about 4 to 6 ms in dogs.(1984)–(1987) During VF, the Purkinje system is active and can either activate the WM orthogradely through the PVJ or be activated retrogradely through the PVJs from the WM.(2007) Therefore, the PF activation complex can occur before, after, or during the WM activation complex, making them difficult to identify during VF. This difficulty is heightened during early VF when no diastolic interval is present. These considerations may explain why Purkinje activations were only rarely identified during the first 2 minutes of VF in either species. Because Purkinje fibers are more resistant than are WM to the ischemia caused by the lack of perfusion during LDVF,(1980) the Purkinje activation complex amplitude does not decrease as much as the WM activation, so that they become easier to identify. Identification of Purkinje activations may also become less difficult because the ischemia of LDVF increases the diastolic interval(1984)–(1985) and may prolong PVJ conduction time.(1987)
The Purkinje fiber signals during LDVF were detected almost exclusively in the endocardial layer of dogs but were scattered transmurally in pigs. These findings correspond to the anatomical distribution of Purkinje fibers in the 2 species. In dogs, the Purkinje network and PVJs are confined to the endocardial layer, so that during sinus and paced rhythm, WM activation propagates from the endocardium to the epicardium. In pigs, the Purkinje network penetrates throughout the LV wall, so that earliest WM activation may be recorded anywhere along a plunge needle, probably depending on where the nearest PVJ is to that particular plunge needle. The transmural extent of the Purkinje system in pigs explains why the total transmural activation time during sinus rhythm is shorter in pigs than in dogs (Figure 5) and why WM activation propagates almost perpendicularly to the epicardium and endocardium during paced rhythm in pigs but not in dogs (Figure 6). Consistent with the distribution of Purkinje fibers in the 2 species, during LDVF, activation rates were faster in the endocardial layer in dogs but were faster transmurally in pigs (Figure 7). In both species, Purkinje activation usually preceded WM activation in electrode recordings in which Purkinje activations were identified, and the activation rate at these electrodes was significantly faster than in electrode recordings in which Purkinje activations were not identified (Figure 8). These findings support the hypothesis that activation during LDVF propagates from the Purkinje system to the WM so that the Purkinje system is important in the maintenance of LDVF. The fact that the activation rate is similar among the 3 layers in both dogs and pigs during the first 2 minutes of VF, suggests that the Purkinje system may not play a key role in maintaining early VF.
While the coronary anatomy of the pig is similar to that in humans,(2008) the anatomical distribution of Purkinje fibers in dogs is similar to that in humans.(1991) Thus, if Purkinje fibers play a role in maintaining LDVF, the activation patterns during LDVF in dogs should be a better representation of LDVF in humans than that in pigs. Once VF is induced, there will be almost no blood flow in the coronary arteries. Thus, the differing coronary artery anatomy between humans and dogs should not affect the VF patterns significantly.
Transmembrane Action Potentials in Purkinje and Nearby WM Cells
The transmembrane action potential recordings from adjacent Purkinje and WM cells also provide evidence that Purkinje fibers play an important role in the maintenance of LDVF. During the first 4 minutes of VF, the activation rates of the 2 types of cells were similar and in some, but not all, cases each Purkinje activation preceded the corresponding WM activation (Figure 10), as would be expected if activations were propagating from the Purkinje system to the WM every cycle. After 4 minutes of LDVF, the mean Purkinje activation rate was significantly faster than the mean WM activation rate, suggesting that either conduction block was occurring at or near the PVJs(2003) or Purkinje and WM activation were dissociated. The mechanism responsible for the Purkinje activation is not clear, although recent studies suggest that early after depolarizations might be responsible.(2010)
As shown in Figure 10, the potentials recorded from both Purkinje and WM were subthreshold. The significant drop in activation potentials probably reflects the waning ability of cells to generate a stimulus sufficient to excite adjacent cells. Our previous LDVF study showed that during late LDVF, only a few wavefronts were present and these wavefronts propagated only a short distance and blocked.(2009) We assume that during late LDVF the majority of Purkinje and WM cells experienced subthreshold activations. Because the Purkinje cells are more resistant to the ischemia than are WM, in some particular areas the Purkinje cells might still activate and stimulate adjacent cells to cause wavefronts to propagate a short distance.
Clinical Relevance
There have been several reports of Purkinje system triggered VT and VF.(2003),(1998) In some long QT syndrome patients with recurrent VT/VF the earliest the local endocardial muscle activation recorded was preceded by Purkinje potentials during premature ventricular beats as well as sinus rhythm.(2003) The ablation of local Purkinje fibers was followed by a disappearance of premature beats.(2003) The in vitro Purkinje fiber is an established preparation that has been used to evaluate the cardiac electrophysiologic effects of antiarrhythmic drugs. The role of the subendocaridal Purkinje network in triggering torsade de pointes has been confirmed in vivo in the long QT syndrome.(2008)
Limitations
The limitations of our study are as follows: (1) The intramural region mapped consisted only of 2 orthogonal planes of 10 and 9 cm2, which encompassed only a limited portion of the LV‐free wall. Thus, a large, global reentrant circuit could have been missed. However, our goal was to detect Purkinje activation and its relationship with WM activation causing as little damage as possible by insertion of the plunge needles. (2) The microelectrode study was performed in an isolated perfused preparation, which has previously been shown to alter most quantitative VF descriptors.(2003) This may explain why the activation rate recorded by the microelectrodes in protocol 2 was slower than that recorded by the plunge needles in protocol 1. Only 2 microelectrodes were recorded during late LDVF, and the potentials recorded in both Purkinje and WM cells were subthreshold. While Purkinje cells activated faster than WM cells, there was no direct evidence to show that Purkinje cells drive the neighboring WM during late LDVF.
Acknowledgments
The authors thank Kate Sreenan for her assistance in the preparation of the manuscript.
Sources of Funding
Supported in part by The National Institutes of Health Research Grants HL‐85370, HL‐64184 and HL‐91138.
Disclosures
None.
References
- Li L, Jin Q, Huang J, Cheng KA, Ideker RE. Intramural foci during long duration fibrillation in the pig ventricle. Circ Res. 2008; 102:1256-1264 [DOI] [PMC free article] [PubMed] [Google Scholar]
- Li L, Jin Q, Dosdall DJ, Huang J, Pogwizd SM, Ideker RE. Activation becomes highly organized during long‐duration ventricular fibrillation in canine hearts. Am J Physiol Heart Circ Physiol. 2010; 298:H2046-H2053 [DOI] [PMC free article] [PubMed] [Google Scholar]
- Huang J, Rogers JM, Killingsworth CR, Singh KP, Smith WM, Ideker RE. Evolution of activation patterns during long‐duration ventricular fibrillation in dogs. Am J Physiol Heart Circ Physiol. 2004; 286:H1193-H1200 [DOI] [PubMed] [Google Scholar]
- Cheng KA, Dosdall DJ, Li L, Rogers JM, Ideker RE, Huang J. Evolution of activation patterns during long‐duration ventricular fibrillation in pigs. Am J Physiol Heart Circ Physiol. 2012; 302:H992-H1002 [DOI] [PMC free article] [PubMed] [Google Scholar]
- Robichaux RP, Dosdall DJ, Osorio J, Garner NW, Li L, Huang J, Ideker RE. Periods of highly synchronous, non‐reentrant endocardial activation cycles occur during long‐duration ventricular fibrillation. J Cardiovasc Electrophysiol. 2010; 21:1266-1273 [DOI] [PMC free article] [PubMed] [Google Scholar]
- Oosthoek PW, Viragh S, Lamers WH, Moorman AF. Immunohistochemical delineation of the conduction system. II: the atrioventricular node and Purkinje fibers. Circ Res. 1993; 73:482-491 [DOI] [PubMed] [Google Scholar]
- Tseng GN, Robinson RB, Hoffman BF. Passive properties and membrane currents of canine ventricular myocytes. J Gen Physiol. 1987; 90:671-701 [DOI] [PMC free article] [PubMed] [Google Scholar]
- Gadsby DC, Cranefield PF. Two levels of resting potential in cardiac Purkinje fibers. J Gen Physiol. 1977; 70:725-746 [DOI] [PMC free article] [PubMed] [Google Scholar]
- Bocchi L, Vassalle M. Characterization of the slowly inactivating sodium current INa2 in canine cardiac single Purkinje cells. Exp Physiol. 2008; 93:347-361 [DOI] [PubMed] [Google Scholar]
- Tseng GN, Boyden PA. Multiple types of Ca2+ currents in single canine Purkinje cells. Circ Res. 1989; 65:1735-1750 [DOI] [PubMed] [Google Scholar]
- Han W, Wang Z, Nattel S. A comparison of transient outward currents in canine cardiac Purkinje cells and ventricular myocytes. Am J Physiol Heart Circ Physiol. 2000; 279:H466-H474 [DOI] [PubMed] [Google Scholar]
- Cordeiro JM, Spitzer KW, Giles WR. Repolarizing K+ currents in rabbit heart Purkinje cells. J Physiol. 1998; 508Pt 3:811-823 [DOI] [PMC free article] [PubMed] [Google Scholar]
- Dun W, Boyden PA. The Purkinje cell; 2008 style. J Mol Cell Cardiol. 2008; 45:617-624 [DOI] [PMC free article] [PubMed] [Google Scholar]
- Tabereaux PB, Walcott GP, Rogers JM, Kim J, Dosdall DJ, Robertson PG, Killingsworth CR, Smith WM, Ideker RE. Activation patterns of Purkinje fibers during long‐duration ventricular fibrillation in an isolated canine heart model. Circulation. 2007; 116:1113-1119 [DOI] [PubMed] [Google Scholar]
- Dosdall DJ, Tabereaux PB, Kim JJ, Walcott GP, Rogers JM, Killingsworth CR, Huang J, Robertson PG, Smith WM, Ideker RE. Chemical ablation of the Purkinje system causes early termination and activation rate slowing of long‐duration ventricular fibrillation in dogs. Am J Physiol Heart Circ Physiol. 2008; 295:H883-H889 [DOI] [PMC free article] [PubMed] [Google Scholar]
- Haissaguerre M, Shoda M, Jais P, Nogami A, Shah DC, Kautzner J, Arentz T, Kalushe D, Lamaison D, Griffith M, Cruz F, de Paola A, Gaita F, Hocini M, Garrigue S, Macle L, Weerasooriya R, Clementy J. Mapping and ablation of idiopathic ventricular fibrillation. Circulation. 2002; 106:962-967 [DOI] [PubMed] [Google Scholar]
- Bansch D, Oyang F, Antz M, Arentz T, Weber R, Val‐Mejias JE, Ernst S, Kuck KH. Successful catheter ablation of electrical storm after myocardial infarction. Circulation. 2003; 108:3011-3016 [DOI] [PubMed] [Google Scholar]
- Haissaguerre M, Extramiana F, Hocini M, Cauchemez B, Jais P, Cabrera JA, Farre J, Leenhardt A, Sanders P, Scavee C, Hsu LF, Weerasooriya R, Shah DC, Frank R, Maury P, Delay M, Garrigue S, Clementy J. Mapping and ablation of ventricular fibrillation associated with long‐QT and Brugada syndromes. Circulation. 2003; 108:925-928 [DOI] [PubMed] [Google Scholar]
- Mlcochova H, Saliba WI, Burkhardt DJ, Rodriguez RE, Cummings JE, Lakkireddy D, Patel D, Natale A. Catheter ablation of ventricular fibrillation storm in patients with infiltrative amyloidosis of the heart. J Cardiovasc Electrophysiol. 2006; 17:426-430 [DOI] [PubMed] [Google Scholar]
- Holland RP, Brooks H. The QRS complex during myocardial ischemia. An experimental analysis in the porcine heart. J Clin Invest. 1976; 57:541-550 [DOI] [PMC free article] [PubMed] [Google Scholar]
- Allison JS, Qin H, Dosdall DJ, Huang J, Newton JC, Allred JD, Smith WM, Ideker RE. The transmural activation sequence in porcine and canine left ventricle is markedly different during long‐duration ventricular fibrillation. J Cardiovasc Electrophysiol. 2007; 18:1306-1312 [DOI] [PubMed] [Google Scholar]
- AHA Special Report Position of the American Heart Association on research animal use. Circulation. 1985; 71:849A-850A [PubMed] [Google Scholar]
- Rogers JM, Melnick SB, Huang J. Fiberglass needle electrodes for transmural cardiac mapping. IEEE Trans Biomed Eng. 2002; 49:1639-1641 [DOI] [PubMed] [Google Scholar]
- Rogers JM, Huang J, Melnick SB, Ideker RE. Sustained reentry in the left ventricle of fibrillating pig hearts. Circ Res. 2003; 92:539-545 [DOI] [PubMed] [Google Scholar]
- Rogers JM, Usui M, KenKnight BH, Ideker RE, Smith WM. A quantitative framework for analyzing epicardial activation patterns during ventricular fibrillation. Ann Biomed Eng. 1997; 25:749-760 [DOI] [PubMed] [Google Scholar]
- Rogers JM, Usui M, KenKnight BH, Ideker RE, Smith WM. Recurrent wavefront morphologies: a method for quantifying the complexity of epicardial activation patterns. Ann Biomed Eng. 1997; 25:761-768 [DOI] [PubMed] [Google Scholar]
- Rogers JM, Huang J, Smith WM, Ideker RE. Incidence, evolution and spatial distribution of functional reentry during ventricular fibrillation in pigs. Circ Res. 1999; 84:945-954 [DOI] [PubMed] [Google Scholar]
- Robinson RB, Boyden PA, Hoffman BF, Hewett KW. Electrical restitution process in dispersed canine cardiac Purkinje and ventricular cells. Am J Physiol. 1987; 253:H1018-H1025 [DOI] [PubMed] [Google Scholar]
- Varro A, Balati B, Iost N, Takacs J, Virag L, Lathrop DA, Csaba L, Talosi L, Papp JG. The role of the delayed rectifier component IKS in dog ventricular muscle and Purkinje fibre repolarization. J Physiol. 2000; 523Pt 1:67-81 [DOI] [PMC free article] [PubMed] [Google Scholar]
- Newton JC, Smith WM, Ideker RE. Estimated global transmural distribution of activation rate and conduction block during porcine and canine ventricular fibrillation. Circ Res. 2004; 94:836-842 [DOI] [PubMed] [Google Scholar]
- Worley SJ, Smith WM, Ideker RE. Construction of a multipolar electrode system referenced and anchored to endocardium for study of arrhythmias. Am J Physiol. 1986; 250:H530-H536 [DOI] [PubMed] [Google Scholar]
- Veenstra RD, Joyner RW, Rawling DA. Purkinje and ventricular activation sequences of canine papillary muscle. Effects of quinidine and calcium on the Purkinje‐ventricular conduction delay. Circ Res. 1984; 54:500-515 [DOI] [PubMed] [Google Scholar]
- Rawling DA, Joyner RW, Overholt ED. Variations in the functional electrical coupling between the subendocardial Purkinje and ventricular layers of the canine left ventricle. Circ Res. 1985; 57:252-261 [DOI] [PubMed] [Google Scholar]
- Rawling DA, Joyner RW. Characteristics of junctional regions between Purkinje and ventricular muscle cells of canine ventricular subendocardium. Circ Res. 1987; 60:580-585 [DOI] [PubMed] [Google Scholar]
- Gilmour RF, Jr, Zipes DP. Different electrophysiological responses of canine endocardium and epicardium to combined hyperkalemia, hypoxia, and acidosis. Circ Res. 1980; 46:814-825 [DOI] [PubMed] [Google Scholar]
- Veenstra RD, Joyner RW, Wiedmann RT, Young ML, Tan RC. Effects of hypoxia, hyperkalemia, and metabolic acidosis on canine subendocardial action potential conduction. Circ Res. 1987; 60:93-101 [DOI] [PubMed] [Google Scholar]
- Sahni D, Kaur GD, Jit H, Jit I. Anatomy & distribution of coronary arteries in pig in comparison with man. Indian J Med Res. 2008; 127:564-570 [PubMed] [Google Scholar]
- Schnabel PA, Richter J, Schmiedl A, Bach F, Bartels U, Ramsauer B, Gebhard MM, Bretschneider HJ. Patterns of structural deterioration due to ischemia in Purkinje fibres and different layers of the working myocardium. Thorac Cardiovasc Surg. 1991; 39:174-182 [DOI] [PubMed] [Google Scholar]
- Xing D, Kjolbye AL, Nielsen MS, Petersen JS, Harlow KW, Holstein‐Rathlou NH, Martins JB. ZP123 increases gap junctional conductance and prevents reentrant ventricular tachycardia during myocardial ischemia in open chest dogs. J Cardiovasc Electrophysiol. 2003; 14:510-520 [DOI] [PubMed] [Google Scholar]
- Robertson PG, Huang J, Chen KA, Chen X, Dosdall DJ, Tabereaux PB, Smith WM, Ideker RE. Increased cycle length during long‐duration ventricular fibrillation is caused by decreased upstroke velocity as well as prolonged refractoriness. Heart Rhythm. 2009; 6:378-384 [DOI] [PMC free article] [PubMed] [Google Scholar]
- Berenfeld O, Jalife J. Purkinje‐muscle reentry as a mechanism of polymorphic ventricular arrhythmias in a 3‐dimensional model of the ventricles. Circ Res. 1998; 82:1063-1077 [DOI] [PubMed] [Google Scholar]
- Ben Caref E, Boutjdir M, Himel HD, El‐Sherif N. Role of subendocardial Purkinje network in triggering torsade de pointes arrhythmia in experimental long QT syndrome. Europace. 2008; 10:1218-1223 [DOI] [PubMed] [Google Scholar]
- Qin H, Kay MW, Chattipakorn N, Redden DT, Ideker RE, Rogers JM. Effects of heart isolation, voltage‐sensitive dye, and electromechanical uncoupling agents on ventricular fibrillation. Am J Physiol Heart Circ Physiol. 2003; 284:H1818-H1826 [DOI] [PubMed] [Google Scholar]


