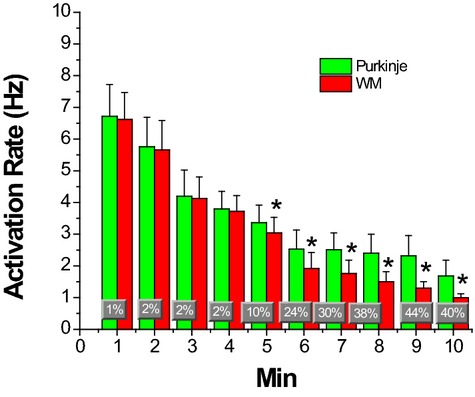
Figure 12.

Mean and SDs of activation rates of Purkinje and WM cells during 10 minutes of LDVF. Percent changes of activation rate between Purkinje and WM are superimposed on the bar graphs. *P<0.01 vs the activation rate of Purkinje cells. LDVF indicates long duration ventricular fibrillation; WM, working myocardium.
