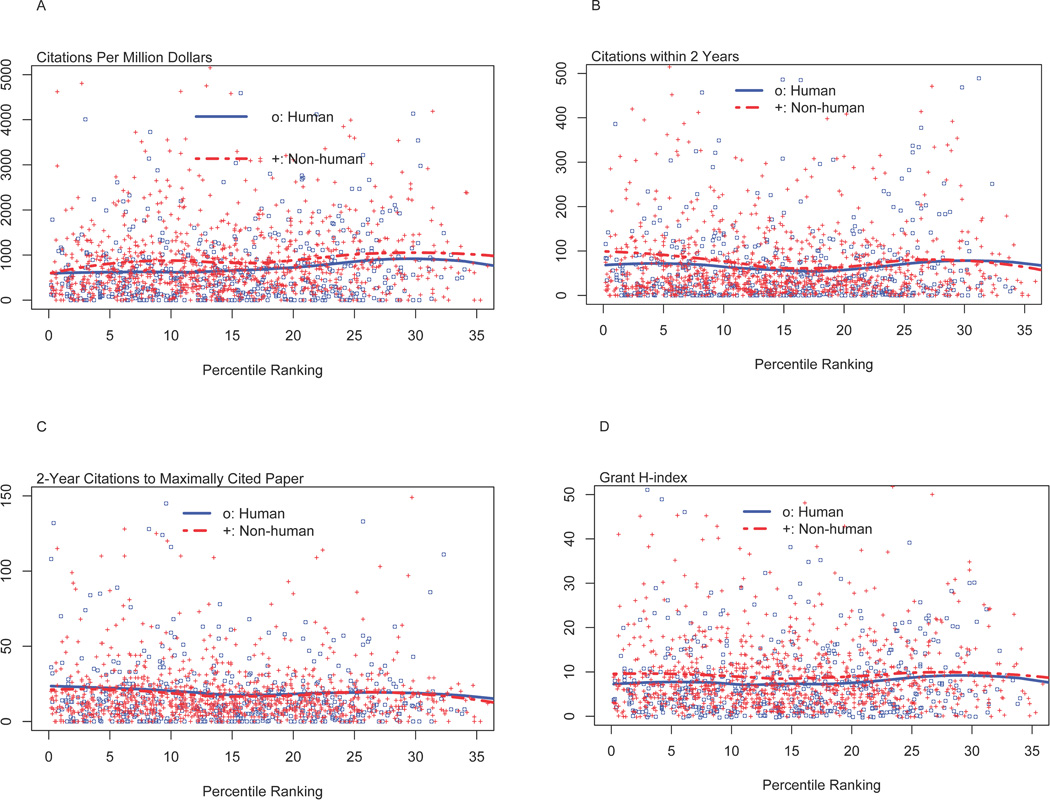
Figure 2.
Bibliometric outcomes according to percentile ranking for 1492 R01 grants that met inclusion and exclusion criteria. All plots show values stratified by human or non-human study focus; curves were generated by LOESS fitting. Panel A shows data for citations received per $million allocated. Panel B shows data for 2-year citations. Panel C shows data for 2-year citations for each grant’s most highly cited paper (i.e., for each grant we identified which paper generated the most 2-year citations, and plot the number of citations generated by that paper according to percentile ranking). Panel D shows data for each grant’s h-index.

