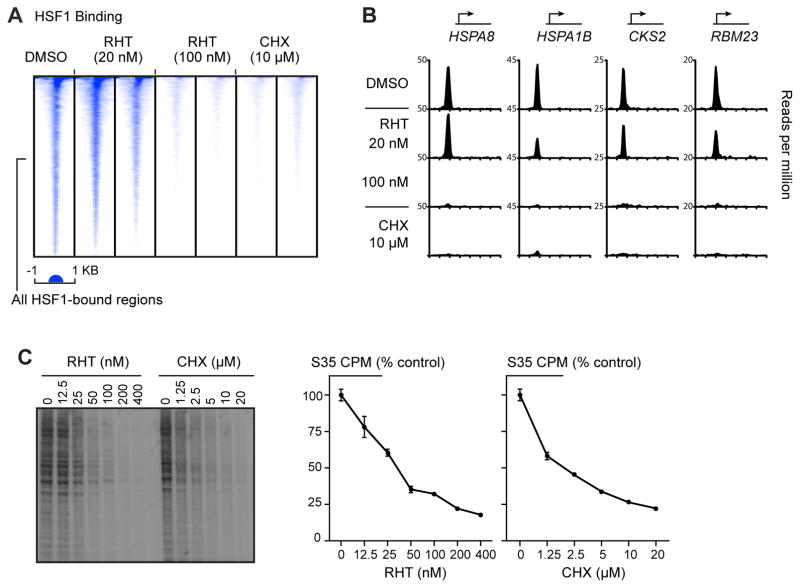
Fig. 4.
(A) Heat map of HSF1 ChIP-Seq read density in M0-91 cells that were treated with DMSO, 20 nM RHT, 100 nM RHT or 10 μM CHX for 6 hrs. Genomic regions from −1kb to +1kb relative to the peak of HSF1 binding for all HSF1 enriched regions (union of all HSF1 enriched regions in the seven data sets depicted here) are shown. (B) Representative HSF1-bound genes in M0-91 cells (HSPA8, HSPA1B, CKS2, and RBM23). x axis: from −2kb from the transcription start site (TSS) to 5 kb from the TSS for each gene. (C) Autoradiograph of S35 labeled protein lysates from MCF7 cells treated for 6 hrs. with the indicated concentrations of RHT or CHX. Graphs show the counts per minute from acetone precipitation of proteins in each sample, quantitated using a scintillation counter.

