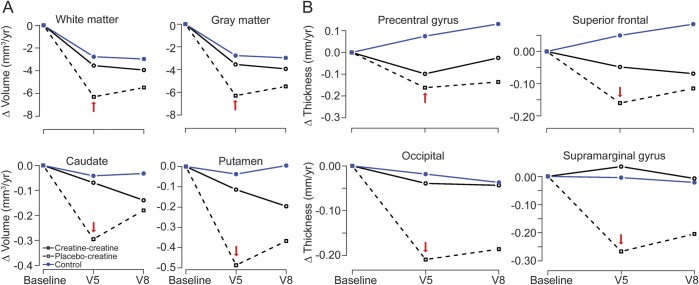
Figure 4. Repeated-measures modeling of 18-month changes confirms the slowing of cortical atrophy in the original placebo group.
(A) Volume. Between visit 1 (V1) and V5, the changes in white matter, gray matter, caudate, and putamen volumes in premanifest Huntington disease (PHD) subjects randomized to creatine were similar to changes in healthy control (HC) subjects. The reduction in these volumes tended to be more rapid in PHD subjects treated with placebo. (B) Cortical thinning. Between V1 and V5, the rates of cortical thinning in PHD subjects treated with creatine were not significantly different than HCs. In contrast, the rates of cortical thinning were significantly faster in the PHD subjects randomized to placebo (p < 0.05). Between V5 and V8, the rate of thinning in the PHD group randomized to placebo slowed significantly after creatine was started (p < 0.01, illustrated in select regions of interest; red arrow indicates the end of the placebo-controlled phase), again suggesting slowed atrophy. Blue = HCs; solid black lines = PHD subjects randomized to creatine at V1; black dashed lines = PHD subjects randomized to placebo who subsequently crossed over to open label.

