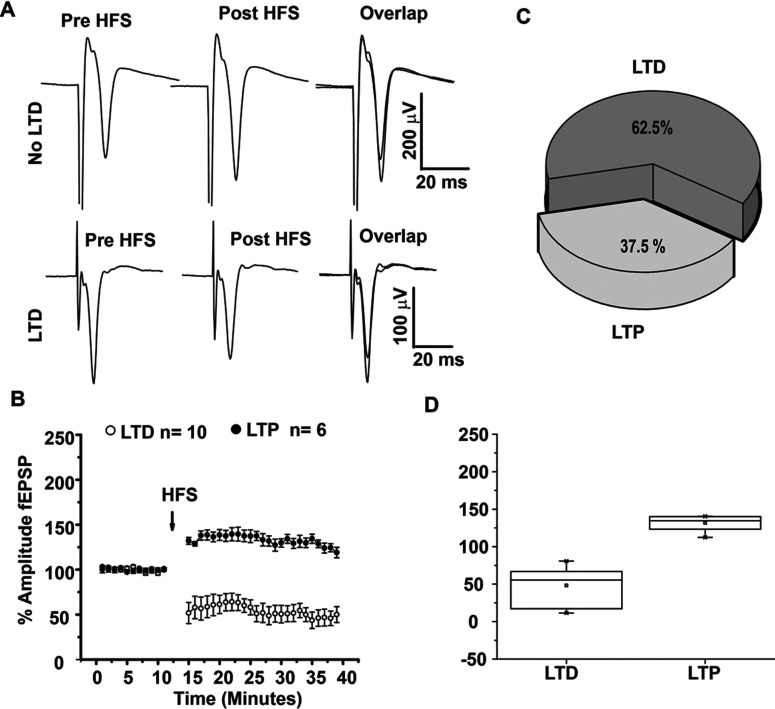
Figure 1. Plasticity of corticostriatal synapses.
(A) Population spikes traces show amplitude increase (LTP) or decrease (LTD) after HFS (three trains, 3 s, 100 Hz) of corticostriatal synapses. population spikes overlaps are magnified in the squares to illustrate population spikes before (black) and after (gray) HFS. (B) Temporal course of population spikes amplitude before and after HFS of corticostriatal synapses. Population spikes are normalized to 100% amplitude in control as a reference through all experimental conditions. (C) In control conditions, 62.5% of population spikes exhibited LTD and 37.5% displayed LTP. (D) Box plots illustrate the distribution of experiments where LTD or LTP was induced in comparison to control which was normalized to 100%. *P<0.0001.

