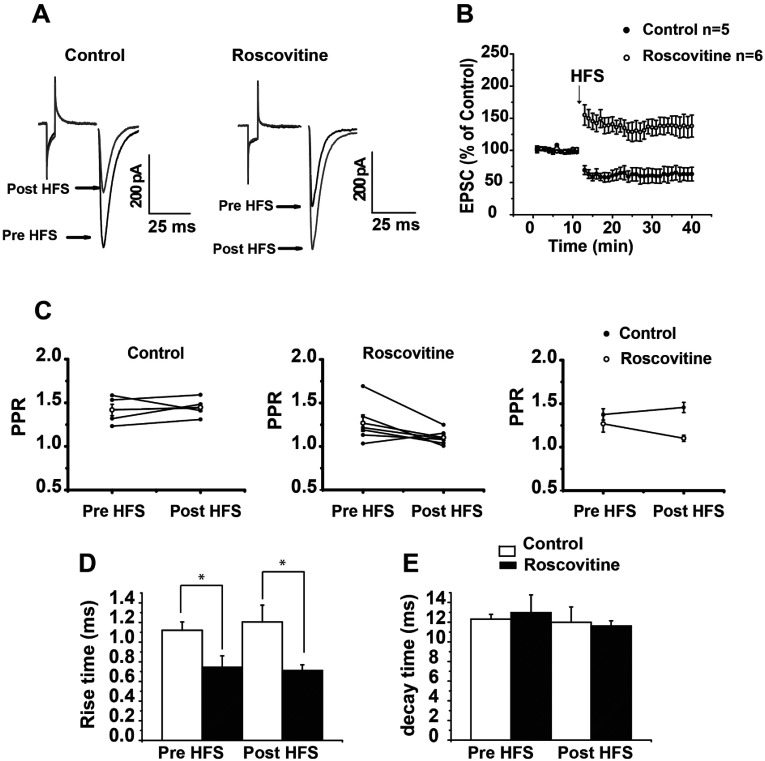
Figure 9. Switching off Cdk5 moves LTD to LTP in individual MSNs.
(A) Representative traces of EPSC in control and in the presence of 20 μM Roscovitine in the bath. The excitatory current decreased in amplitude after HFS, and increased in amplitude after HFS if Roscovitine was present in the recording bath. (B) Temporal course of EPSC after HFS in control conditions and in the presence of Roscovitine. (C) PPR did not change in control or in the presence of Roscovitine. (D) Illustrates the rise time of EPSC in the control compared to Cdk5 block. Rise time pre- and post-HFS significantly changed between groups. (E) Illustrates decay time EPSC in control compared to when Cdk5 was blocked. No changes were found between groups. *P<0.03.

