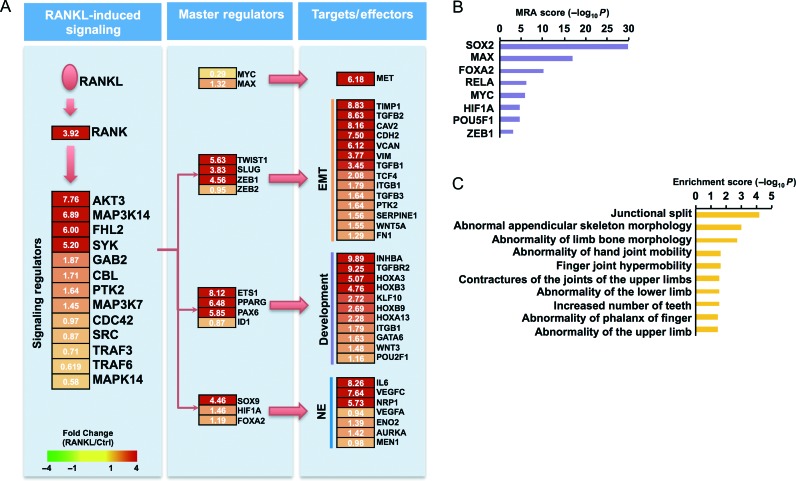
Figure 3.
RANKL-perturbed network and master regulators. (A) RANKL pathway with upregulated genes in RANKL-overexpressing cells. RANKL-perturbed signaling and key TFs are shown. Node colors represent fold change in RANKL-overexpressing cells compared with controls. EMT, epithelial-to-mesenchymal transition; Development, development-related genes including differentiation and stemness; NE, neuroendocrine differentiation. (B) Independent analysis to identify master regulators predicted by master regulator analysis (MRA) score, which is −log10 transformed value of significance (P values). (C) Bioinformatics analysis using g:Profiler revealed that bone-related diseases are representative features of RANKL-overexpressing LNCaP cells.

 This work is licensed under a