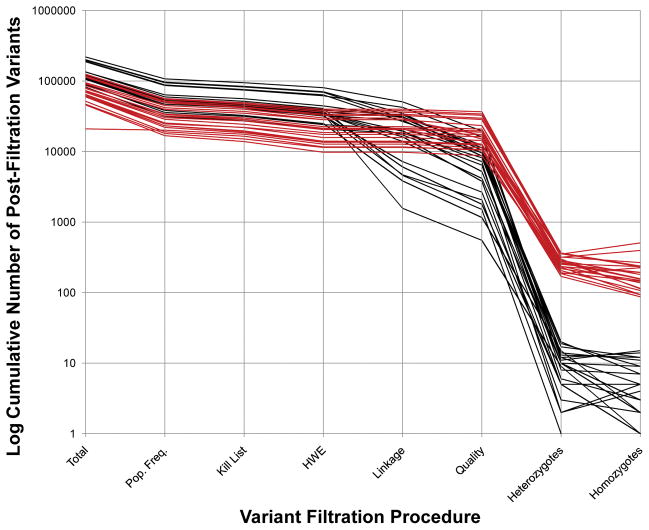
Figure 1.
Cumulative Filtration of Exome Variant Lists from 22 Families. A set of 22 exome projects is displayed using two different analytical approaches: one uses all available family data (black) and the other uses only data from the proband (red). The y-axis is the log10 of the number of cumulatively filtered, residual variants. The x-axis shows filtration steps, which are sequential from left to right. The last two steps (homozygotes and heterozygotes) use the post-quality-filtration variants to filter and are not sequential. Note that the implementation of homozygote and heterozygote filters differs between single exome analyses and family based analyses. Mendelian segregation and phase information is not available in the case of single exome analysis. Homozygotes are not checked for inheritance from both parents. The “heterozygote” count is a tabulation of all pair-wise combinations of variants for those cases where more than one heterozygous variant is found in the same gene. Single exome projects start with fewer variants and end with a larger number of candidates for further study. See the text for a further explanation of the various filtration steps.

