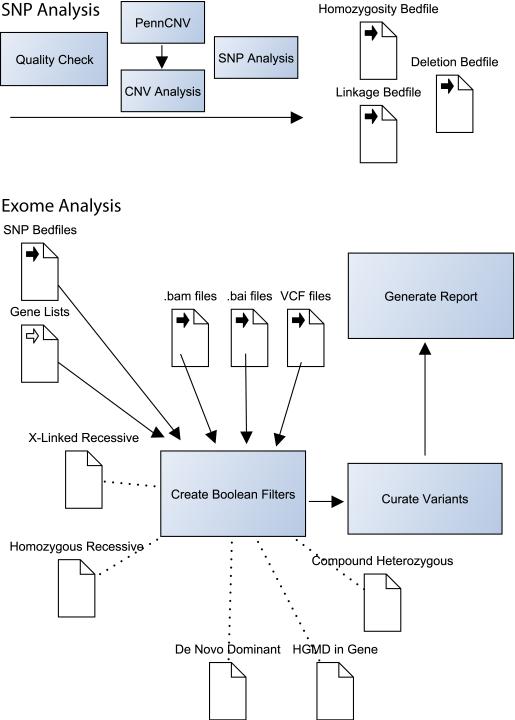
Figure 1. Selected Components of the NIH UDP Analysis Pipeline.
The NIH Undiagnosed Diseases Program analysis pipeline combines exome data with high-density SNP array data. We find that this is a cost-effective method for combining deep coverage of coding regions with a genome-spanning structural survey. SNP chips are checked for quality then analyzed for copy number variations (CNVs) with PennCNV (http://www.openbioinformatics.org/penncnv/). The list of CNVs is manually curated and combined with manual analysis for homozygosity and verification of parentage. If sufficient family members are available, Boolean searches and further manual curation are used to map recombination sites. CNVs, recombination sites and other regions of interest are defined in Browser Extensible Data (BED) file format for incorporation into later analysis. Subsequent exome analysis utilizes two primary programs: IGV and VarSifter (see text). The former is used to visualize pile-ups in the assembled BAM file and the second is used to incorporate BED file filters, allele frequency data, pathogenicity data and gene lists. VarSifter also allows the construction of arbitrary Boolean filters, providing fine control over searches for subsets of interest.

