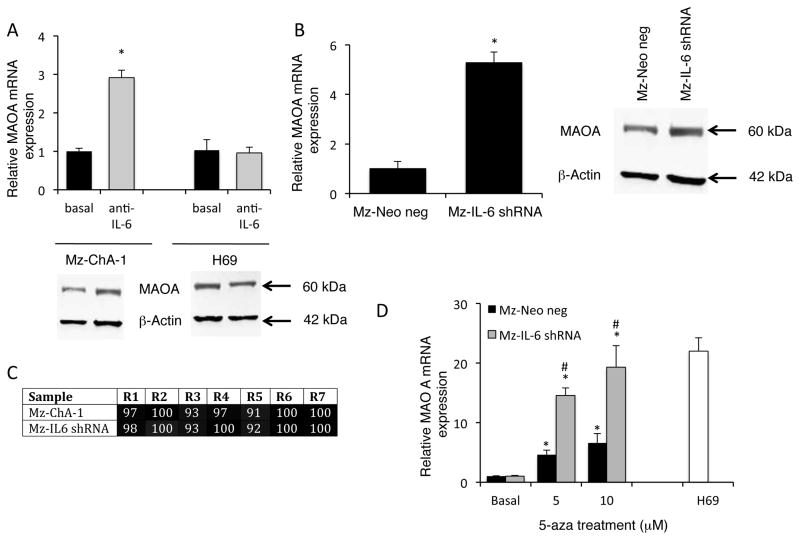
Figure 4. MAOA expression is regulated by IL-6 signaling.
Mz-ChA-1 and H69 cells were treated with an anti-IL-6 neutralizing antibody for 4 days. MAOA expression was assessed by real time PCR and immunoblotting in these treatment groups (A). In parallel, MAOA expression was assessed in cell lines stably expressing IL-6 shRNA (Mz-IL-6 shRNA) compared to the control cell line (Mz-Neo neg) by real time PCR and immunoblotting (B). The degree of promoter hypermethylation in Mz-IL-6 shRNA and Mz-Neo neg cells was assessed by pyrosequencing and expressed on a gray-scale (C). Mz-Neo neg and Mz-IL-6 shRNA cells were treated with 5-aza-2-deoxycytidine (5-aza) for 4 days and MAOA expression was assessed by real time PCR and compared to MAOA levels in H69 cells (D). Real time PCR data are expressed as average ± SD (n=4). (*p<0.05 compared basal-treated samples; #p<0.05 compared to the same treatment in the Mz-Neo neg cells). Representative MAOA immunoblots are shown andβ-Actin was used as the loading control.

